Introduction to Further Applications of Trigonometry
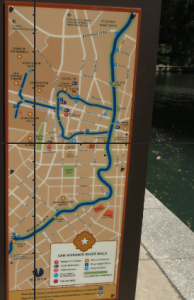
Have you ever considered the many different ways to map a space? In Algebra, we use a Cartesian plane and identify distinct coordinates, often as [latex](x,y)[/latex] coordinate pairs, within the plane to demarcate a position. For instance, superimposing [latex]x-[/latex] and [latex]y-[/latex]axes onto the map below identifies San Antonio’s landmarks in relation to The Alamo (located at the origin of the Cartesian plane). You can see the resemblance of a grid pattern in San Antonio’s city streets in the map pictured, but the grid pattern isn’t distinct.
San Antonio isn’t the best example of a city laid out in a grid-style location system. It was founded in 1718 as the Mission San Antonio de Valero, along with a nearby military garrison known as San Antonio de Bexar as a stopping place on the trail through the Texas wilderness known as the Chisholm Cattle Trail. This trail was developed organically by animals and early human settlers based on terrain and access to water resources (displayed prominently in the map!).
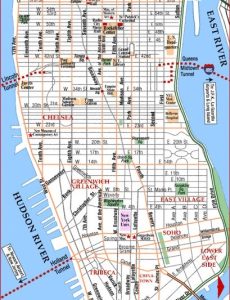
Instead, examples of intentional grid development patterns visibly characterize cities along the eastern coast of the United States such as Philadelphia and New York. This system, which often establishes North-South and East-West axes based on a global compass, was developed by early civilizations for efficiency and interchangeability of routes, facilitating the ease of transportation and the defense of the city.
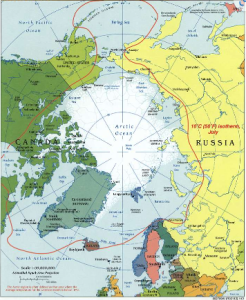
In addition to spacial models established in a Cartesian Plane, we can use a two-dimensional polar grid to identify the position of objects based on their angle and distance from a pole. Polar grids and polar graphs are used in global navigation and orientation to identify an exact location either as degrees from the North or South pole and direction East or West, or in precalculus as coordinate pair [latex](r,θ)[/latex]. In both cases, there is an identifiable pole that’s chosen and an orientation from the pole (or origin) that’s determined.
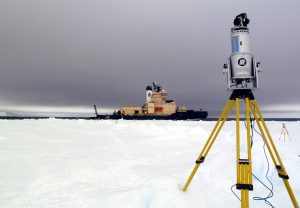
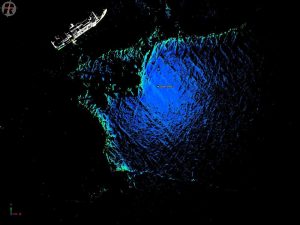
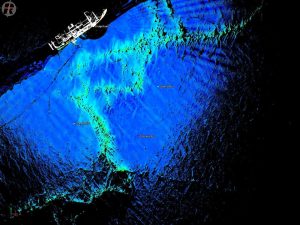
LiDAR, or Light Detection and Ranging, is a specific type of three-dimensional target-based mapping device that establishes itself as the pole in a polar grid to scan surface features of the earth. Lasers in the device calculate distance and determine angles to geoposition objects in the environment. The Department of Earth and Planetary Sciences at UTSA owns a LiDAR scanner and has deployed its use during two expeditions to the polar regions of Earth (in 2015 to the Arctic and in 2017 to the Antarctic). Dr. Blake Weissling, a UTSA researcher involved with both projects, used the LiDAR scanner to investigate the effects of climate change in the region.
Below are some scans produced by the LiDAR tool when it was used in Antarctica to map regional ice features during the 2017 PIPERS expedition in the Ross Sea.
Students enrolled in remote sensing or Global Information System courses at UTSA will learn how to use this technology to create images of local geologic features, like rock outcrops for instance. In fact, UTSA is currently involved in a project to scan rock outcrops in Government Canyon State Park where dinosaur tracks have been found.
♠ ♣ ♥ ♦
In addition to learning about polar grids and graphing, in this chapter you will explore the mechanics of working with complex numbers: translation of complex numbers from polar form to rectangular form and vice versa, interpretation of complex numbers, and an introduction to De Moivre’s Theorem. You will also have the opportunity to solve for products and quotients of complex numbers in polar form and solve for powers of complex numbers using DeMoivre’s Theorem.
These are just a few of the important concepts and ideas included in Chapter 5. A complete list of the Key Takeaways from the chapter is organized in the table below:
Key Takeaways
- Plot points using polar coordinates and find several polar coordinates of a single point.
- Convert polar coordinates to rectangular coordinates and vice versa.
- Transform equations from polar form to rectangular form and vice versa.
- Graph simple polar equations by converting them to rectangular form and then use Algebra to graph the rectangular equation.
- Plot points in the complex plane.
- Convert complex numbers from rectangular to polar form and vice versa.
- Use the trigonometric form of complex numbers to multiply, divide, and raise these numbers to natural powers.
