Chapter 10 – Uniformitarianism and the Age of the Earth
Uniformitarianism and the Age of the Earth
Learning Objectives
Welcome to Chapter 10. At the end of this chapter you will be able to:
- Define the principles of Uniformitarianism and Catastrophism
- Identify things that can be used to determine an annual count and an approximate age of relatively young time periods
- Define the difference between relative dating and radiometric dating
- Discuss the three types of radioactive decay
- Interpret half-live and geologic ages by using a graph
- Calculate numeric age of a rock unit given information about half-life and parent atoms
- Explain how we know the age of the Earth
The Age of the Earth I, Great Basin and Layer Counting
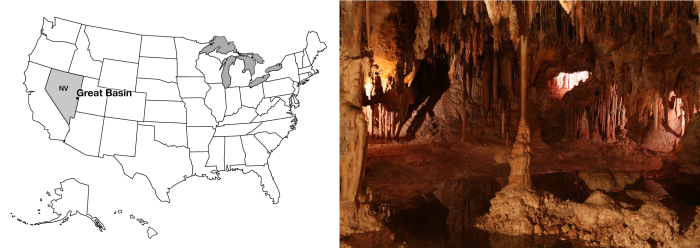
Credit: Left: R. B. Alley © Penn State is licensed under CC BY-NC-SA 4.0
. Right: Pools in Lehman Caves, National Park Service (Public Domain),
Out in eastern Nevada, a long way from almost anywhere, is Great Basin National Park. The jewel of Great Basin is Lehman Cave, one of the most “decorated” caves known, with a wide range of odd cave formations (stalactites and stalagmites, but lots more, too). Lehman Cave is dissolved into marble (metamorphosed limestone) on the side of Wheeler Peak, which rises to more than 13,000 feet (almost 4000 m), and which was glaciated during the ice age—the remnant cirque glacier has wasted away to a debris-covered rock glacier over the last decades. Fewer than 100,000 visitors make the trek to Great Basin each year, and you can find a lot of solitude and wonder in this beautiful place.
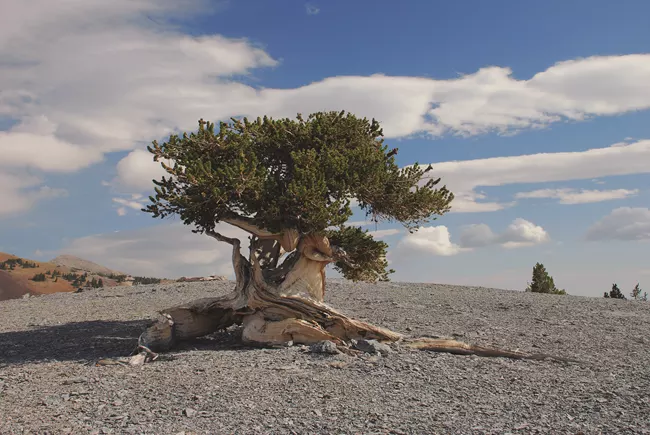
Far up on Wheeler Peak, Great Basin bristlecone pines are living. These gnarled, straggly trees grow slowly in high, cold places, whereas those bristlecone pines growing in warmer, moister, lower-elevation sites live faster and die younger. In part because of this slow growth, the high-altitude trees can be very old. The oldest known living bristlecone pine is more than 4,600 years old, in the White Mountains of California. The oldest tree known so far was cut on Wheeler Peak in 1964, when the land was still administered by the U.S. Forest Service, as part of a study to learn more about the growth and behavior of the trees. Now known as Prometheus, that tree was 4,950 years old when cut. That one old-looking tree was not notably different from many others in the large grove. Because it is so unlikely that the first such tree cut on Wheeler Peak out of the many there would happen to be the oldest tree on Earth, it is likely that there are older trees out there that have not been sampled yet.
In a seasonal environment, a tree reliably produces a visible growth ring each year. The reasons for this behavior are well-understood, and the annual nature of the rings has been checked many, many times. Rarely, there is a problem (a piece of a ring may be missing if the tree was damaged, by a fire or a burrowing beetle, or a late frost or other odd event may make a ring look strange), but tree-ring daters (dendrochronologists) have learned to recognize these events. In general, tree-ring dating can be practiced with no errors. Many, many tests have been conducted to confirm that this works, that the results match historical records, etc. Most such sampling is done using narrow coring devices, and does not harm the trees.
In studying tree rings, one sees that the width is not the same from year to year. Thick rings grow during “good” years, and thin rings during bad years. This allows tree rings to be used to reconstruct past climates. In a dry area, a good year is a wet one, so tree rings can be used to find out how much rain fell in the past. In a cold area, a good year is a warm one, so the tree rings function as thermometers.
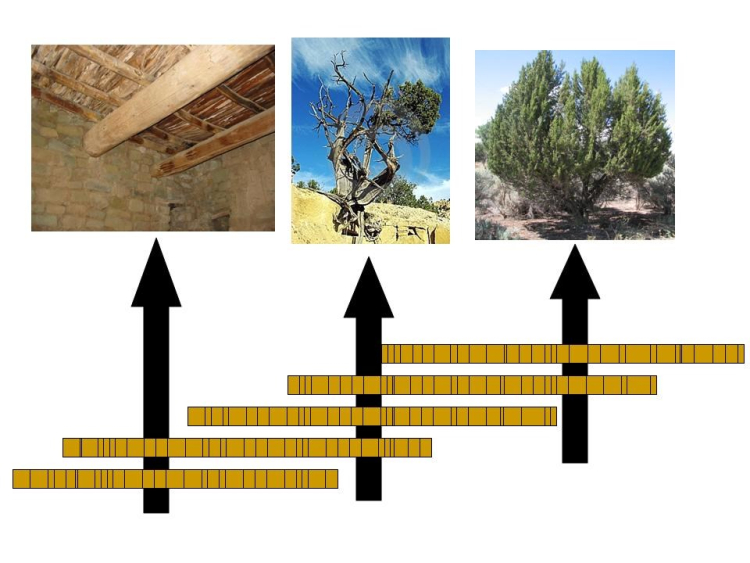
For our purposes here, the pattern of good and bad years (fat and thin rings) is important for dating. On Wheeler Peak, and in the White Mountains and elsewhere, dead trees occur near the living bristlecones. Some of these dead trees sprouted before the living ones and overlapped in age with the still-living trees. Other dead trees can be found in archaeological sites or buried in sediments. A tree-ring specialist can date the good and bad years using living trees. The specialist can then find the pattern of thick and thin rings in the dead tree, and so use the dead tree to extend the record back to when the dead tree first sprouted (see the figure below). By overlapping a few long-lived trees, or many short-lived trees, very long chronologies can be generated.
So How Many Layers?
Such techniques are used to date archaeological sites, including those of the Ancestral Puebloan peoples (also called the Anasazi; at Mesa Verde and several other national parks). Professor Peter Ian Kuniholm and his collaborators at Cornell have for decades been doing amazing work using tree rings to understand classical history in the Aegean region, the Middle East, and elsewhere, confirming, refining, and extending historical accounts. The beautiful agreement between tree-ring and historical accounts as far back as the oldest reliable written records confirms the accuracy of the techniques.
Credit: Crossdating
. National Park Service (NPS) (Public Domain).
But, the tree-ring records extend well beyond reliable written histories. The longest tree-ring record in the U.S. Southwest is now more than 8000 years. The longest known of such records is from tree trunks buried along rivers in Germany, and extends to 12,429 years—before that, closer to the heart of the ice age, conditions were too cold for trees in that region of Germany. Because most trees live for “only” centuries rather than millennia, such records (and a few other really long ones, such as a 7,272-year record, as of 1984, from Irish oaks buried in bogs) represent immense investment of time and effort, but people have devoted whole careers to assembling these outstanding records. Notice that there is much older wood, including the fossil trees at Yellowstone, Petrified Forest, and elsewhere. The more than 12,000 years in Germany are the longest continuous record reaching the present, but surely do not come anywhere close to including the whole history of trees.
Several other types of annually layered deposits exist. For example, some lakes in cold regions freeze every winter. When the lake is thawed in the summer, sand and gravel are washed in by streams. When the lake and its surroundings freeze, the streams slow or stop, and the only sediment settling to the lake bottom is the very fine silt and clay particles that were washed in during the summer but require months to fall. A coarse layer capped by a fine layer marks one year. Many such layered, or varved, lakes have been studied, and found to contain thousands of years to more than 14,000 years. Many of these lakes occur in glacier-carved basins, and so their records extend only back to the melting of the ice. One lake in Japan, Lake Suigetsu, has a spring bloom of diatoms—algae with silica “shells”—that make a light-colored layer, alternating with darker mud during the rest of the year. 45,000 annual layers have been counted in that lake.
Most lakes lack annual layers. If there is a lot of oxygen in the deep waters, worms will thrive in the mud beneath, and their burrows will disturb the layers. If the lake is shallow, waves will disturb the deep muds. But enough lakes exist with annual layers to be useful. And, simply seeing layers doesn’t prove they are annual; lots of tests have to be done, as described below for the ice cores.
A difficulty in lakes—and other archives such as annually layered stalagmites—is that an annual layer must be thick enough to be recognized, but a lake or a cave will fill up quickly if layers are thick, so the records cannot be extremely long.
Longer records are possible from the two-mile-thick ice sheets. Dr. Alley has been very active in this work, and Dr. Anandakrishnan has contributed in important ways. In central Greenland and some other places on ice sheets, the temperature almost never rises high enough to melt any snow and ice. However, summer snow and winter snow look different because the sun shines on the snow in the summer, “cooking” the snow and changing its structure, but the sun does not shine on the winter snow, which is buried by new storms before the summer comes. You can count many, many layers by looking at an ice core, and Dr. Alley did so, working especially on one core called GISP2.
To verify that the layers are annual, several things were done. First, one person (Dr. Alley) looked at the core, waited a while, and then looked at it again to see that the counting is reproducible. Then, other people counted the layers visible in the core (without cheating by finding out what Dr. Alley had gotten), just to make sure they agreed.
There are many annual indicators in ice cores, probably more than a dozen. For example, the isotopic composition of the ice is a thermometer that records summer and winter. And sunshine makes hydrogen peroxide in the air in the summer when the sun shines, and the peroxide falls on the ice quickly, but there is almost no peroxide made and deposited in the dark winter. So annual layers have been counted using several different indicators, and they agree closely.
This is still not good enough. When a large volcano erupts, it throws ash and sulfuric acid into the stratosphere. These spread around the Earth. The bigger pieces of ash fall out quickly, often in days or less, while the sulfuric acid may take one to a few years to fall (and, until it falls, affects the climate by blocking a little of the sunlight). You can use electrical or chemical techniques to find the layers of volcanic fallout in ice cores. The key sections can then be cut out, melted, and filtered, and any volcanic ash that is found can be analyzed chemically and compared to that from known volcanic eruptions. So, if you count back to the year 1783 in a Greenland ice core, you are in the year of the great Icelandic fissure eruption of Laki, which spread dry fogs across Europe and is well recorded in histories—Ben Franklin commented on the fogs in Paris while he was ambassador there for the fledgling United States. In fact, ash of the composition of Laki occurs in Greenland ice cores at the level dated 1783 by layer counting—the layer counting is right (or very close—some counts missed by a year or two initially). Similarly, ash from many other historical volcanoes has been found, back as far as historically dated volcanoes are known.
Comparison of counts of strata by one person at different times, by different people, and by different methods, and comparison to volcanic fallout, yield almost the same answers, within about one year in one hundred (so one person may count 100 years, and another will count 99, or 100, or 101, but not 107 or 93 or some similarly large error).
There are a few more tests yet. There were very large and very rapid climatic changes at certain times in the past. Ice cores record the climatic conditions locally (how much snow accumulated and how cold it was), regionally (how much dust and sea salt and other things were blowing through the air to the ice from sources beyond the ice sheet), and globally (by trapping bubbles of air, which contain trace gases such as methane that are produced across much of the Earth’s surface). Changes in all of these indicators occur at the same level in the ice cores, showing that the climate changes affected much of the Earth.
These changes left their “footprint” in the ice of Greenland, and the lakes of Switzerland and Poland, and the trees of Germany, etc. So one can date such changes in the annually layered deposits of all of these different places. And, the dates agree closely. These events also have been dated radiometrically (we’ll cover this soon), and the dates also agree closely. One event, for example, was a return to cold conditions during the end of the ice age, and is called the Younger Dryas. Close agreement as to its age is obtained from all of these different layered deposits and from radiometric ages—the Younger Dryas ended about 11,500 years ago.
Thus far, the layers in the ice cores provide the longest reliable records. Over 100,000 layers have been counted. High accuracy was achieved younger than about 50,000 years, with somewhat lower reproducibility (maybe 20% or so, and with well-understood reasons for the lower accuracy) older than about 50,000 years. Still older ice exists, but the layers in Greenland have been mixed up by ice flow and no longer give a reliable chronology. Thus, we have high confidence of more than about 100,000 years from the ice cores. (Really old ice in Antarctica, to 800,000 years or so, got less snowfall in a year than the height of a snowdrift, so annual layers are not preserved and other dating techniques must be used.)
Why Are We Emphasizing This?
One of the great results of geology has been the concept of “deep time.” The world was once believed in some cultures to be only as old as the oldest historical records. The Archbishop Ussher of Ireland, in the year 1664, declared that based on Biblical chronologies, the creation of the Earth dates from October 26, 4004 BC, Adam and Eve were driven out of the Garden of Eden on Monday, November 10 of that year, and Noah’s Ark landed on Mt. Ararat on Wednesday, May 5, 1491 BC. Other experts obtained slightly different dates, but with broad agreement that the world was not very old.
Ussher’s date rested on a literal reading of the particular translation of the Bible he used, and on quite a number of questionable interpretations of the text—the Bible itself never gives an age for the Earth. Early geologists nonetheless struggled with the constraints provided by such chronological readings—how could all of geologic history fit into 6000 years? The early geologists ultimately reached the conclusion that the world looks MUCH older than 6000 years; either the world is older than this, or we have been deliberately fooled by some powerful being who crafted a young world to look old. As scientists, we work with the observable part of the world, and we have no way to detect a perfect fake, so we treat this as an old world. The geologic record speaks of “deep time,” billions of years, Shakespeare’s “Dark backward and abysm of time.”
Most biblical scholars have reached the same conclusion: the chronologies of Genesis do not allow one to fix the age of the Earth precisely, and are perfectly compatible with an old Earth. Most of the large Christian denominations, for example, have accepted an old Earth based on Biblical and on scientific interpretations. In 1996, the pope added the Catholic Church to the wide range of protestant denominations that accept an old Earth.
It remains that some denominations and people insist on what they call a “literal” reading of the Bible. In addition, a few very vocal people continue to argue that the Earth looks young. Many more people hear all of this commotion and figure that maybe there is something wrong with the science, because “where there’s smoke, there’s fire.” Other people take it as an element of faith to disbelieve the scientific evidence, and even to accuse scientists of being bad people for opposing the fundamentalist interpretations.
In this course, we go to some length to show you a small bit of the evidence that the Earth does not look young—it bears the marks of a deep and fascinating history. The annual-layer counts by themselves require an old Earth, because the tree rings, the lake sediments, and the ice cores all extend to older than the historical chronologies. The Irish oaks preserve rings from more than twice as many years as Archbishop Ussher of Ireland would have said were possible since Noah’s flood, so his prediction was tested, and failed. Geologic and other scientific evidence from tree rings, lake sediments, ice cores, archaeological sites, and more match historical records well as far back as those historical records go. But as we shall see in the next sections, those annual layers and other “young” things are only the tip of a very old, very deep iceberg.
Please note that it is not the author’s intent to insult or belittle anyone’s beliefs here. Science, you may recall, has no way of verifying whether it has learned the truth; it is a practical undertaking designed to discard ideas that fail, save the ones that don’t fail as provisional approximations of the truth, and push ahead. The hypothesis of an Earth that is no older, and looks no older, than historical records, leads to all sorts of predictions. Geologists began seriously testing those predictions in the 1700s, and found that those predictions were not supported, whereas predictions of an old-Earth hypothesis worked well—with very high confidence, the rocks look very old.
Consider two people, Sam and Pam. Sam has decided that belief in his literal interpretation of his favorite translation of the Bible is the most important thing in his life, as it controls the fate of his eternal soul and his relation with the most powerful being in the universe. Is it possible for Sam to look at the rocks, trees, ice and lakes, and find some way to explain what he sees in the context of that literal belief? The answer, obviously, is yes; many people do so, and some of them will be mad at us for what we write here. Next consider Pam, who is working in an oil-company laboratory trying to refine dating of petroleum generation and migration. Which works best for her in making sense of the sedimentary record, Sam’s interpretation or that of the geological profession? The answer is equally clear; Sam’s view is unhelpful, and geology works. Finally, ask whether it is possible for Sam to be a geologist and use the old-Earth tools even as he believes in his book, or whether it is possible for Pam to be a religious believer while doing geology, and the answers are yes; some people can hold a variety of ideas in mind at the same time. But recognize that the scientific evidence for an old Earth (and later, for evolution) is about as clear as science gets, and that the level of scientific disagreement on these issues is about as low as disagreement ever gets in science. Within the scientific community, the argument about whether the Earth really is older than historical records is akin to the scientific argument about whether the Earth is roughly spherical. (Lively discussions clearly continue in the blogosphere and in other many non-scientific circles, but those discussions are at best rather weakly linked to the science.)
More on the Age of the Earth—Uniformitarianism and The Grand Canyon
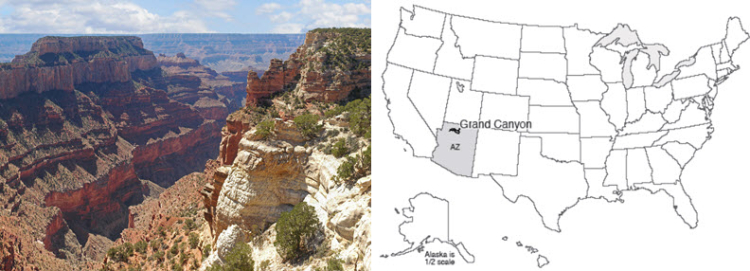
Credit: Left: Grand Canyon National Park
, via Flickr is licensed under CC BY 2.0, Right: R. B. Alley © Penn State is licensed under CC BY-NC-SA 4.0
The Grand Canyon is a mile-deep, 18-mile wide, 277-mile long (1.6 km x 29 km x 446 km) gash in the Earth. The colorful spires, the rocky cliffs, the hidden pocket canyons, the pristine springs laying down lovely deposits, the roaring thunderstorms and arching rainbows are to many the quintessence of the U.S. West. The Grand Canyon is neither the deepest nor the steepest canyon of the planet, but the Grand Canyon indeed is grand, and defines “canyon” for many people.
When the author, his cousin Chuck, and his sister, Sharon, were hiking the Bright Angel Trail from the North Rim into the canyon, a snake crossed the trail and slithered into some dry grass just at the trail edge. Chuck and I, in the lead, could see quite clearly that this snake ended in a “harmless” tail. Sharon, just behind, was not aware of the snake until it stuck its head out and rattled the grass just at her feet. Deciding that discretion was the better part of valor, and that if it rattles like a rattler it might actually be one, she made one mighty leap backward, landing in a cloud of dust on a switchback below.
Sharon almost certainly was not concerned with the rocks about her at that instant, but she had leaped backward through history. And what a history it is.
The Longest Story
At the bottom, the inner canyon is cut through the Precambrian Vishnu and Brahma Schists. The older Vishnu has the appearance and chemical composition of metamorphosed sediments. The lava flows of the Brahma preserve the pillow structure of submarine eruptions, but the interbedded volcanic airfall material shows that at times the region was exposed as dry land. The total thickness of three miles of lava flows and interbedded layers, now standing almost on end although they initially were deposited almost horizontally, speaks of an important, long-lasting interval of deposition.
These oldest lava flows and sediments of the Grand Canyon have been “cooked,” and are now of metamorphic types that form only in the hearts of mountain ranges at very high pressures and temperatures. During and after the metamorphism, melted rock (magma) squirted into cracks in these rocks, and then froze to form the pretty pink Zoroaster Granite. Yet this whole package of rocks was then brought back to the surface as the rocks of the mountains above them were eroded, with the erosion producing a very smooth, nearly horizontal plain on top of them, and weathering/soil formation causing changes that extend deep into these rocks.
The sea next advanced across this plain, first picking up and carrying and rolling pieces of the rocks and soils on the erosion surface to form a conglomerate, then giving way to sandstones, shales, and limestones that piled up to a thickness of two miles or so. (Such a great thickness does not mean that the sea was two miles deep; rather, in this case, the water stayed relatively shallow, but the warping of the crust by the drifting plates and other processes caused the sea floor to sink as the muds and other deposits piled up.) These rocks include mud cracks, ripple marks, casts of salt crystals that formed when the sea water evaporated in nearshore environments, and stromatolites, which are algal-mat deposits in which the algae trap mud, grow up through it, and trap more mud. All of these are similar to modern features, and indicate gradual accumulation (a layer, then drying for mud cracks, then more mud, then ripples from water flow, then drying for salt casts, and on and on and on).
Death-Valley-type pull-apart faulting then dropped and rotated these layers, so that they now slant (see the figure below). Long-term weathering and erosion then occurred, leading to a plain broken by a few higher points where especially resistant rocks did not erode as rapidly. Again, deep weathering speaks of long exposure. In some places, the sediments were entirely removed down to the metamorphic rocks beneath, but the sediments are preserved where they were dropped by faulting.
The sea returned, again reworking materials on the erosion surface to make a basal conglomerate, followed by beach sandstone, then offshore shale, and limestone from farther offshore. As the sea deepened and the beach moved towards the land, shale was deposited on sandstone and then limestone on shale. These three layers form the Tonto Plateau that is so evident on the south side of the canyon. The rocks of the Tonto Plateau include fossils of marine animals such as trilobites, and even trilobite tracks. Again, all evidence is of deposition by processes just like those operating today, over long periods of time. A layer with a trilobite track must have been exposed long enough for a trilobite to crawl across it. The thousands and thousands of different layers in the rocks, with ripples and tracks and fossils, indicate long times.
Time then passed of which we have no record in the Grand Canyon, except that stream channels were carved on top of the limestone, indicating that the region was raised out of the sea and erosion was occurring. Fossils from two of the periods of the Paleozoic are missing, indicating that much time passed. When deposition resumed, the first rocks put down were limestones in the stream valleys, but another time gap sits on top of those in-the-channel rocks. The limestones in the channels include coral and shellfish (brachiopod) fossils, and plates from armored fish.
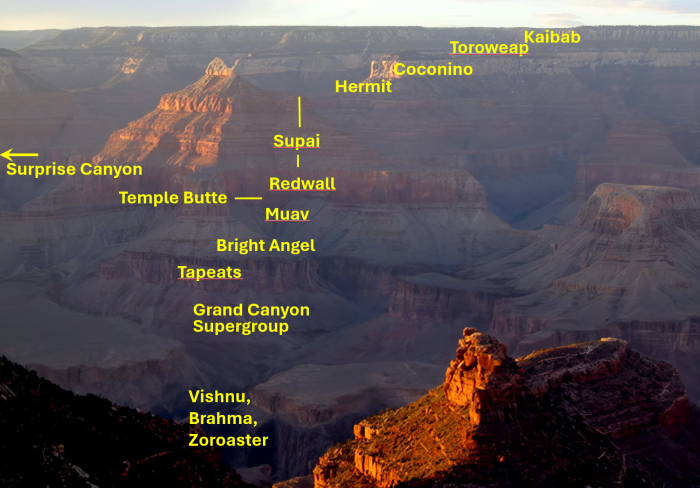
Credit: R. B. Alley © Penn State is licensed under CC BY-NC-SA 4.0
The marine Redwall Limestone was deposited next, so-named because it makes a red wall. The limestone is gray, with the red (rust and clay) dripping down from red rocks above. The Redwall Limestone contains fossils of corals, sea lilies (crinoids) and shellfish (brachiopods), but with notable differences from the fossils of those general types found in limestones below, and both sets of fossils differ from those in limestones above. The Redwall Limestone contains caves and sinkholes, which in turn contain sediments associated with the rocks above. Caves generally form on land or possibly very close to land under shallow water, not beneath the open ocean, so the rocks were lifted near or above sea level and eroded after Redwall deposition.
Then, the sea flooded in, at least in the region that would become the western part of the Canyon, and deposited the Surprise Canyon limestone in erosional stream channels in the top of the Redwall. These rocks were not even described until the 1980s, and are only reachable by helicopter or arduous climbing. These rocks are not indicated in the diagram, above, which is what you would see on the Bright Angel Trail in the central Grand Canyon. Erosion cut the top of the Surprise Canyon before deposition of more layers.
Next are sandstones, siltstones and shales with plant fossils, footprints, etc., at various levels through the rocks, indicating deposition on land in floodplain conditions. Insect fossils appear on the upward trip through the rocks, and then great dunes with sand-blasted, wind-frosted grains and occasional lizard footprints. You might imagine the sand dunes of the Sahara spreading across the flood plain of the Nile for these rocks. Marine conditions then returned, providing mostly limestones with sponge fossils and shark’s teeth as well as corals, crinoids and brachiopods, finally reaching the top of the canyon.
If you’re on the North Rim of the Canyon, gaze farther north. The rocks you’re on slant downward to the north, and you are looking at rows of cliffs with younger rocks, up through the cliffs of Zion from the age of the dinosaurs, up through the lakes of Bryce, up and up and up until finally you reach the trees and Native American sites older than the historical chronologies of Archbishop Ussher.
(By the way, if you’re interested in the carving of the Grand Canyon, have a look in the Unit 10 Enrichment.)
How Old?
A pile of rocks like those in the Grand Canyon does not reveal its age easily. But we have evidence of seas, mountain building, mountain erosion, more seas, more distortion, more erosion, and more, and more, and more. The rocks involved are old friends—similar things are forming today. Using the principle of uniformitarianism—the present is the key to the past—we can make some estimate as to how long events take. The schists at the bottom were buried miles deep in mountain ranges and later brought to the surface by erosion, and fast erosion rates require a million years to strip off a mile, for example.
The geologists of the 1700s, working primarily in Europe, pieced together stories such as this. They tried to estimate the times involved. One difficulty was that they could not tell how much time was in the erosional time gaps, or unconformities—was erosion fast, or slow? And they could not really unravel all of the stories in the oldest rocks because metamorphism had erased some of the stories.
These early geologists eventually estimated that the rocks told of events that required AT LEAST tens of millions of years to hundreds of millions of years. Just depositing the sedimentary rocks would take about that long, with much more time represented by the unconformities and the oldest really-messed-up rocks. This is deep time—the Earth is not the historical thousands of years, or even the ice-layer/tree-ring tens of thousands of years. History was written and trees grew on the relics of vastly greater histories. Looking into that history is one of the great joys of geology, but it brings us to the edge of a mental cliff from which some people do not wish to look. In the next section, we will see just how high that cliff really is.
Radioactive Clocks
The techniques of layer counting and uniformitarianism are useful in dating, but the real workhorse these days is radiometric or radioactive dating. The Earth is host to a wide range of naturally occurring radioactive elements. An atom of a radioactive element eventually will spontaneously change to some other type of atom, by emitting radioactive energy.
Radioactive decay occurs in various ways. The easiest to understand is when a nucleus splits into two parts, kicking out a part of itself. Remember that heat causes molecules in water to bounce around and occasionally evaporate; atoms or molecules in rocks are also bouncing around, but are so tightly bound that very, very few break free at the Earth’s surface. In somewhat the same, way, the protons and neutrons in the nucleus of an atom are always wiggling and bouncing around; most nuclei are so tightly bound that this wiggling doesn’t change anything, but some types of nuclei are weakly enough bound that occasionally some protons and neutrons “evaporate.” We call those types of atoms that “evaporate” radioactive, and those that do not stable. (A real nuclear physicist would probably yell at us because we oversimplified a bit too much, but this should do for introductory geology.)
Commonly, a nucleus that “evaporates” emits a group of two protons and two neutrons, which is the nucleus of a helium atom and also is called an alpha particle, for historical reasons. Emitting an alpha particle changes the remainder of the nucleus to the type of atom that is two protons lighter. Other types of radioactive changes also occur, including splitting of a nucleus into nearly equal-sized chunks, change of a neutron to a proton plus an electron that is emitted, or capture of an electron by a proton to change into a neutron. All of these change the type of atom from one element to another. All are explainable by well-known physical principles, and all are as natural and regular as the downward fall of your pencil if you drop it off your desk.
The behavior of any one atom is not predictable, but in large groups the average behavior is easily predictable. The basic rule is that, if you watch for some specified time such as one hour, the more radioactive atoms you start with, the more radioactive atoms you will see change. If you start your stopwatch when you have some number of a given type of radioactive atom, and stop the watch when half have changed, you will have estimated the half-life of the radioactive type. Each radioactive isotope has a distinctive half-life, which can be measured in the laboratory. (Note that you do not need to wait for an entire half-life to measure it; the Enrichment section shows mathematically that you need to wait only long enough for enough atoms to change to be measured accurately—the rule that more change in some time if you start with more is all you need.)
Suppose you start with 2000 atoms of the parent type. These decay into offspring (most textbooks refer to these offspring as daughters). After one half-life, 1000 parent atoms remain and 1000 offspring have been produced. After another half-life, half of those 1000 parent atoms have changed to offspring, leaving 500 parents and giving 1000+500=1500 offspring. After a third half-life, half of the remaining parents have changed, so that now only 250 parents remain and 1500+250=1750 offspring have been produced. During the fourth half-life, half of the remaining parents decay, leaving only 125 parents and giving 1750+125=1875 offspring.
Now, we really need to deal with large numbers, so add ten zeros to the end of each of the numbers in the previous paragraph. Such numbers of radioactive atoms are common in even relatively small samples of rock; the total number of atoms in a fist-sized chunk of rock is about 1 followed by 24 zeros.
As noted, there are many different parent types with different half-lives. Some half-lives are very short—seconds or less. Others are very long—billions of years or more. Some of the radioactive parents are left over from the explosions of stars that produced the stuff of which the Earth is made. Other radioactive parents are created by cosmic rays that strike atoms on Earth. Some radioactive decays produce offspring that are themselves radioactive parents for a further generation, and several such decays may be required to produce a stable offspring. And radioactive decays may damage neighboring atoms, producing radioactive types.
Telling Time
Consider the example of potassium-40 and argon-40. Argon-40 has 18 protons and 22 neutrons in its nucleus, for a total of 40 particles. Potassium-40 has 19 protons and 21 neutrons, also totaling 40. Potassium-40 is a parent with a half-life of 1.3 billion years. Potassium is abundant on Earth, and occurs in many common minerals, and some of the potassium is the radioactive parent potassium-40. The offspring, argon-40, is a gas. If lava flows out on the surface of the Earth, the argon escapes. Thus, a lava flow will start with some parent potassium-40 but no offspring argon-40. As time passes, the potassium-40 breaks down to argon-40, which builds up in the rock. If today the rock has as many potassium-40 as argon-40 atoms, then one half-life has passed and the rock is 1.3 billion years old. Whatever the ratio is, the math is not that difficult and gives the age.
It is possible, of course, for argon-40 to leak out of the mineral. If it does, we will think that the rock is younger than it really is. But if leakage is occurring from a mineral grain, then the outside of the grain will contain less argon-40 than the inside does, and this can be measured, revealing the problem. A mineral grain that grew in slowly cooling melted rock far down in the Earth and that then was erupted may have begun trapping argon-40 before the eruption occurred, in which case the age obtained will be the time when the grain started growing rather than the time when the eruption occurred. Scientists do not blindly apply dating techniques; they think about what is being measured, and apply a little common sense.
But isn’t it possible that the radioactive “clocks” ran at a different rate in the past? Some of the most free-thinking physicists have suggested slight changes in physical “constants” over time; couldn’t that affect the clocks? A critical difficulty with this seemingly “easy” idea is that the forces controlling the stability of atomic nuclei (hence the rate of radioactive decay) are the forces involved in all sorts of other processes including energy generation in the sun and other stars, so if you tweak the “clock” very much, you have turned off or blown up the sun, and we know that has not happened.
There is an easier argument against changing decay rates. The techniques of radiometric dating have been tested against layer-counting ages and historically documented ages of events, and found to agree beautifully. Radiometric dating techniques also have been tested against uniformitarian results, and found to be fully consistent. The techniques have been tested against each other—one sample can be dated using several different parent-offspring pairs—and good agreement is found. (Short-lived parent-offspring pairs are used to date young things—in old rocks, all of the parents are gone—and long-half-life pairs are used to date old things—in young things, the number of offspring is too small to allow accurate measurement—but enough different types exist that intercomparisons are still possible.)
You won’t have to look very far on the web to find sites—usually attached to fundamentalist Christian ideas—complaining about errors in radiometric dating. (And Dr. Alley was once shown a published tract pointing out how stupid Dr. Alley himself must be to think that he could count more annual layers in an ice core than the total age of the Earth!) Some of the objections to radiometric dating are fairly silly, and even some of the young-Earth sites have put up notes asking followers to avoid using certain common arguments against scientists because those arguments are just wrong. The 5000-year-old living clam falls in this category. (See the Enrichment if you want to get the low-down on “old” living clams.) The bottom line is that radiometric dating is useful, practical, successful, matches written records as far back as they go, matches other indications beyond that, and reveals a deep and fascinating history. Radiometric dating is not perfect, it does include errors, practitioners have to know what they’re doing and think about it, but it works.
The oldest rocks found on Earth are about 4 billion years old, and some of those contain mineral grains recycled from even older rocks. The active Earth has almost certainly erased the record of its very earliest rocks. Meteorites probably formed from the solar nebula at about the same time as the Earth did, and since have fallen on the Earth. The oldest meteorites are about 4.6 billion years old, and that is our best estimate for the age of the Earth. Careful analyses of the changing lead isotopic ratios over time (from decay of uranium) also yield that number for the Earth. And 4.6 billion years is, indeed, is deep time.
GeoMations
Climbing the Canyon
Credit: Dr. Richard Alley
Transcript: At the bottom of The Grand Canyon, deep in its channel, flowing out of the page towards you is the glorious Colorado River. And next to the river, there are rocks that were sediments. They have been lava flows and other things. They have been bent in the heart of a mountain ranges. They have been intruded by granite. They have had the heck beat out of them.
And on top of them, there is an unconformity– an erosion surface. Sitting on top of that erosion surface, there are various sedimentary rocks– things that formed on the edges of a sea interbedded with lava flows. There are many erosion surfaces within that pile of sedimentary rocks.
And that is an immense pile of sedimentary rocks that has been dropped down by faults. If you actually try to measure the thing, you find that you get some thickness, and then you walk along the layer, and then you measure some more thickness. And the total thickness is actually about two miles of sediments in pile. And then on top of that, there is another erosion surface. That was the Grand Canyon Supergroup in that two-mile pile.
Sitting on top of this, the sea came in, and you end up with the Tapeats Sandstone, and you get the Bright Angel Shale, and you get the Muav Limestone. And then sitting on top of that, there was erosion, there are deep channels in places that were cut on top. And in those channels, one goes in and finds little bits of pockets of the Muav Limestone sitting in there. The sea had come in. The sea goes out, the sea comes back and puts in the Muav. It goes out and erodes again, and then you get the giant Redwall– the great, massive Redwall.
And the top of that is also eroded. And it has some channels. And it wasn’t until the 1980s, when, really, helicopter geology came in, that people realized that, in fact, some of those channels have little bits of limestone in them called the Surprise Canyon. The sea had gone out, it came back and put that down, it goes out, and there’s erosion again.
And then sitting on top of this, we get the great rocks of the Supai. The Supai is ocean sediments– limestones– to the west, and it is a delta. It’s up on land to the east. It’s about four different units, and there’s an erosion surface that goes at the end of each of those different units of the Supai.
The Supai then gave way to the mighty cliff of the Coconino. This is the sand dune rocks. This is the one that has all the beautiful tracks in it and so on. And on top of that, there’s another erosion surface. Then there’s sort of a mix of land and sea sediments that’s known as the Toroweap that makes it a bit of a slope. And it has an unconformity and erosion surface.
And then sitting on the top of this is the cliff of the Kaibab Limestone, which gets up to the villages where you can go as a tourist. But this, in turn, slants down to the north. And underneath that, you’re going to find Zion way up there, and then you’re going to find Bryce, and so on, up through the giant pile of rocks.
Widening and Narrowing
Credit: Dr. Richard Alley
Transcript: I was out at the Grand Canyon a few years ago. And I was standing behind the fence there. And I was talking to a very nice and knowledgeable ranger about the history of mining at the place. And we were looking at those incomparable cliffs. And there’s sort of a cliff of limestone, and a slope of shale, and a cliff of sandstone on another slope, and so on, on down to the river sitting way down below someplace like that.
And while we were standing there talking, this gentleman walked up, and he asked us why the river had gotten narrower. And we gave him a confused look. And he said, well, the river down there is very narrow. But if you try to look all the way across to the North Rim which is way the heck over there, what you see is, in fact, that the top is very broad. So he sort of figured that the river had been wide, and then it had gotten narrow.
Now, right beyond the fence there was a bit of a crack down into the cliff-forming rock there. And I ask him whether he would have any interest in going out beyond that crack and taking a jackhammer and starting to work on it. And he offered the opinion that eventually it would break off. And that when it broke off, that he would end up somewhere down the slope with a big rock on top of him, and that that would not be a good thing to do.
Well, then I ask him if he looked across the canyon, did he see places where a lot of rocks had piled up that looked like they had fallen off of the cliff. And he said, well, yeah I do. And that one fell. And this was a bright person. He immediately got it. He says, oh, what happens then is that the river must cut down. And once the river has cut down some, then, this slow process of mass wasting is going to widen it.
And in particular what happens is that the shales, the slope-formers cut down. And that makes the cliffs higher. And if the cliffs get really high, they tend to fail, and blocks fall off. And so that after a while you look at it, and you find that the canyon sort of has the same shape that it used to. But it’s gotten wider as well as getting deeper as the river comes down.
Credit: Dr. Richard Alley
Transcript: It is 4.6 billion years ago. You were on the goal line Beaver Stadium and you have to drive 100 yards to today where you’re taking Geosciences 10. The earth is forming 4.6 billion years ago. Giant meteorites are streaming in. And when they hit the surface, they make great explosions and collisions that heat the planet so much that they evaporate the ocean. And the last one of those that was big enough to evaporate the upper part of the ocean that was warmed by the sun and given energy by the sun is about 3.8 billion years ago, which leaves you 83 yards to drive to get to the goal.
Beyond this, the continents are forming. They’re no longer getting blasted. And so you start to see continents show up that the cores of the modern things and they’re sitting out there very nicely. And they are formed so that you get an idea of what the world is going to be like by about 2.5 billion years ago, which is a mere 54 yards to get your touchdown.
There are bacteria in the ocean and the bacteria are committing acts of flatulence. They’re putting oxygen up. The oxygen changes the composition of the atmosphere, it changes the oceans, and it eventually allows bigger critters to appear. And those bigger creators include shelly critters which suddenly make lots of interesting rocks, limestones. And so you start to get lots of shells showing up about 570 million years ago, which is a mere 12 yards to get the goal line. The shells are doing really well.
And then there’s a really bad day. The ocean gets very warm from greenhouse and it belches out bad gases and most of the things alive die. And that happens about 225 million years ago at the end of the Paleozoic which is only five yards from the goal.
That clears up space so that you start to get dinosaurs. And as you know, dinosaurs were really big and they’re sort of cute critters. And so you start getting dinosaurs in the Mesozoic. And here is a dinosaur if you would like one. and the dinosaurs are having a fine time and they’re smiling a lot.
But there’s another meteorite coming. And so the big meteorite comes screaming in and it kills the dinosaurs, and that changes the world a lot. And that happens about 65 million years ago which is only one and a half yards from the goal.
That makes room for mammals to show up, and so you start to see mammals such as this elephant that you’re about to see here. This elephant happens to be running away from you. And the elephant has some big ears and a really curly tail.
And that comes up to recorded history. And recorded history, 6,000 years ago, just a little over the thickness of a sheet of paper.
And finally, to the culmination of creation to you, who are born about 1/200th of the thickness of a sheet of paper from the goal line today.
Optional Enrichment Article
Carving the Canyon, and More on Radioactive Dating, and Radiocarbon and “Old” Living Clams
Carving the Canyon
A vigorous river is capable of cutting downward at 1 mm/year (or more, and glaciers may cut faster than that). At 1 mm/year, it takes 25 years to cut an inch, or only about 1.6 million years to cut a mile down and make the Grand Canyon. Usually, rivers don’t cut as fast as 1 mm/year because the rivers quickly get down close to sea level, which makes the river’s slope smaller and slows the erosion.
The Grand Canyon likely owes its existence to several events. The most important may have been the opening of the Gulf of California, south of Death Valley, as we saw way back at the beginning of making mountains. Opening of the Gulf of California brought the ocean closer to the mountains, which steepened the streams heading toward the Gulf—the height of the mountains wasn’t changed by opening the Gulf, but the horizontal distance a river had to flow from the mountains to sea level got shorter as the land ripped open and the ocean extended over what had been river bed on land, so the average slope of the river increased.
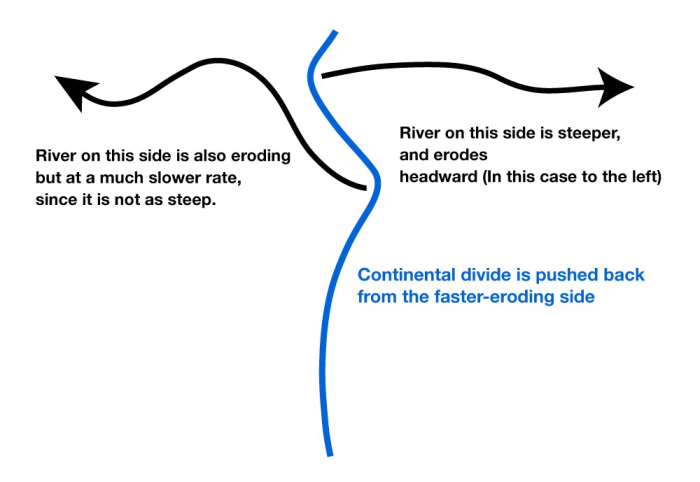
A “continental divide” is the line on a map separating the rivers flowing to one ocean from the rivers flowing to another ocean. As you might imagine (and as we discussed briefly back in the history of the closing of the proto-Atlantic and opening of the Atlantic), the slope to one ocean from a continental divide is often steeper than the slope to the other ocean. The steeper side generally erodes faster, which causes the continental divide to move away from the steeper side toward the more-gradual side. (Eventually, this will lead to the slopes being similar on the two sides.)
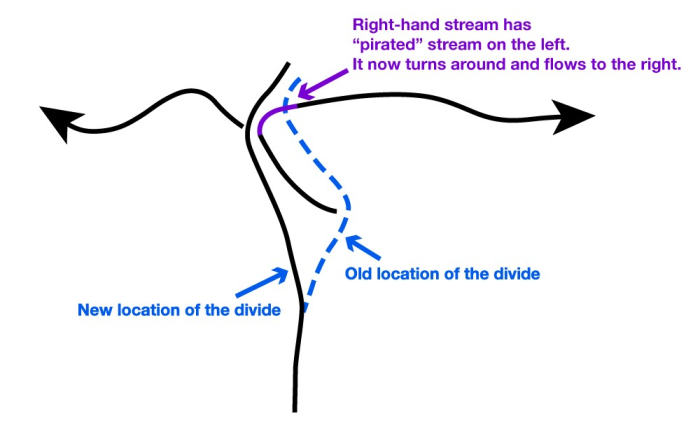
But, the continental divide is irregular, not a straight line. Where a big river forms and cuts down, the slope from the divide to the river will be steeper than nearby, so erosion will be faster there and the divide will be forced away. Sometimes, this will cause the divide to intersect and “capture” the drainage of a stream that had been on the other side of the divide. (See the figure below.)
Credit: R. B. Alley © Penn State is licensed under CC BY-NC-SA 4.0
Credit: R. B. Alley © Penn State is licensed under CC BY-NC-SA 4.0
The upper panel in the figure shows two rivers (the black lines with arrows), separated by a continental divide (the blue line), viewed from above. If the right-hand river is steeper, then it will erode back until the headwaters of the left-hand river are “captured” in an act of “stream piracy,” as shown by the magenta line.
There are lots of small rivers in the West with fairly big canyons—look at the most-of-a-mile deep canyon of the small Virgin River in Zion, or the remarkable amphitheater that tiny Bryce Creek has gnawed into the Paunsagunt Plateau to make Bryce Canyon. So, when the Gulf of California opened, the ancestral lower Colorado River steepened and cut headward (probably involving a piracy event with a stream exploiting the easily eroded San Andreas Fault), and pirated the ancestral upper Colorado River, which previously probably had drained internally (the river ran out into the desert and evaporated, the way some rivers do in Death Valley). This happened just over 5 million years ago; at that time, chunks of rocks of types that occur only up in the Rockies at the head of the Colorado River suddenly appear in sediments of the Gulf of California, where before chunks of such rock types were absent in the Gulf of California.
Why did it take the Colorado so long to cut the Canyon, then? Well, the Death-Valley-type Basin-and-Range faults associated with the opening of the Gulf of California also have cut across the Canyon, especially in the western end. Basaltic lava has come up some of the faults, much as happened in Death Valley. At several times over the last 5 million years, lava flows have dammed the Canyon, making lakes. Lakes accumulate sediment rather than eroding, while the erosive ability of the river is spent cutting through the dam. So, the river really had to cut down much more than a mile to make the canyon—cut down, get filled with lava, cut the lava, get filled again.
Why you don’t need to wait for a half-life to pass to measure it
In the text, you saw how radioactive decay occurs and provides “clocks” for the ages of rocks. Here, we go into a little more detail on the math, strictly for your entertainment and enjoyment.
The “law” of radioactive decay says that the more atoms of some radioactive parent you have, the more atoms of that parent will decay in some time. (There are many laws of this type: hotter bodies cool faster, rooms with more cats have cats run out the door faster, etc.). In addition, each radioactive parent type decays at its own particular rate. This is easier to say mathematically than in words. Given N parent atoms of some type, the change dN in the number of that type over some interval of elapsed time dt is:
The minus sign occurs because the number of parent atoms is decreasing over time. The K is a constant, called the decay constant (and often indicated with the Greek lambda, but we’ll stick with K). The numerical value of K is different for each different radioactive parent type, and includes the “physics” of how unstable the parent type is. A large K means a very unstable parent and a very rapid change to offspring; the units of K are inverse-time (so 1/seconds or 1/years).
If you never studied calculus, or you forgot what you studied, you won’t make much sense of the next little bit. Don’t worry. Those of you who took a calculus course and remember it will know that you can rearrange the equation to obtain:
Integrating yields:
in which ln indicates the natural logarithm, C is a constant that we will determine, and t is the total time that has elapsed. Taking the exponential of both sides, and noting that the decay started at some time t=0 when there were N=N0 parent atoms, yields the standard decay equation:
in which exp indicates the exponential (it usually appears as ex or exp or inv ln on calculators). The negative in front of Kt is equivalent to writing N=N0/exp(Kt). As t becomes large, exp(Kt) becomes very large, so N=N0/exp(Kt) becomes very small—the equation says that after a long time, you run out of parent atoms, which is correct.
Notice that if you can measure N0, wait for some time t1 and then measure N, the only unknown in this standard decay equation is K, so K can be calculated readily. The natural logarithm, ln, reverses the exponential so that ln(exp(-Kt))=-Kt. The natural logarithm appears on most calculators as ln or ln x or possibly as inv exp. Using this,
You usually will see this written as:
using one of the properties of logarithms.
We next estimate the half-life, t1/2. Note that after one half-life, N=N0/2. (So half of the parents have changed after one half-life.) If we let N=N0/2 in the standard decay equation, take the natural logarithm of both sides, remember that -ln(1/2)=ln2, and rearrange, we obtain t1/2=(ln2)/K. This is the basis for the statement in the text that you do not need to wait for a full half-life to pass if you wish to learn the half-life; you just need to start with N0, wait for any time t1, measure N, calculate K from this, and then calculate t1/2 from K. The half-life is useful, but most professionals in the field use the decay constant K most of the time, because K is more “fundamental” (it appears in the statement of decay given first above, and does not need to be derived as for the half-life).
Radiocarbon Revisited
Skeptics about the use of scientific age dating in geology have especially focused on complaining about radiocarbon dating. This focus is odd, because radiocarbon—also called carbon-14—is not used in establishing the age of the Earth, or the age of the main geological events. The half-life of radiocarbon is only 5730 years; samples older than about 50,000 years have nearly run out of radiocarbon and so cannot be dated by radiocarbon. But, radiocarbon is used a lot in dating archaeological sites, and this may have caught the attention of people who study early written histories. In addition, as you will see, radiocarbon is more complex than many others (such as the potassium-argon system discussed in the regular text), and it is easier to argue about complex things.
Much of the complexity of radiocarbon arises because the offspring of radiocarbon (the gas nitrogen-14) is very common, and is not retained well by the samples that are dated using radiocarbon (wood, charcoal, bone, or other formerly living things—not most rocks). Thus, radiocarbon dating does not look at the parent-to-offspring ratio; instead, the starting concentration of radiocarbon is estimated, the concentration today is measured, and the ratio gives the age. Radiocarbon is mostly made in the atmosphere, when cosmic rays collide with atoms and knock off neutrons that then hit nitrogen-14 nuclei and make carbon-14. This doesn’t happen very rapidly; natural production is just about 15 pounds for the whole Earth per year, or just over two carbon-14 atoms per square centimeter (just under 1/2 inch on a side) of the Earth’s surface per second.
In the atmosphere, radiocarbon quickly combines with oxygen to make carbon dioxide. The atmosphere is well-mixed—release some gas molecules here, and within a few years they will be spread fairly uniformly around the planet—so the radiocarbon-bearing carbon dioxide is quite uniformly distributed around the globe. Green plants grow by using carbon dioxide, and roughly one of each trillion carbon atoms in the atmosphere and in green plants is carbon-14 rather than stable carbon-12 or carbon-13. Plants are eaten by animals. Most animals live less than 100 years, whereas most carbon-14 lasts thousands of years, so when plants and animals die, they have just about the same ratio of carbon-14 to carbon-12 as was in the atmosphere when they were still alive. After plants or animals die, they do not breathe or eat any more, so they don’t take in carbon-14 while the carbon-14 in them decays. Hence, the ratio of carbon-14 to carbon-12 in a formerly living material is a clock.
Whole textbooks can be written refining the previous two paragraphs, and a scientific journal, Radiocarbon, focuses almost exclusively on the topic. If you aren’t a real stickler for accuracy—if “this died sometime between 9,000 and 11,000 years ago” is good enough for you—then you really don’t need a whole journal devoted to radiocarbon. (You still need to worry about one or two things that we’ll come to, but not about too many.) But if you want to get the answer right to within a few decades, then you have to be really careful.
One problem is that production rates of radiocarbon have varied over time. When the sun is more active or the Earth’s magnetic field is stronger, they protect us more from cosmic rays and reduce production of radiocarbon. The changes are not huge, and there are ways to correct for them (strength of magnetization can be estimated from the degree of alignment of the “magnets” in lava flows or sediments of different ages, and ice-core concentrations of beryllium-10, which is also made by cosmic rays, can be used to track the sun and the magnetization).
Changes in the Earth’s carbon cycle also matter. For example, now we are pulling up immense quantities of really old fossil fuels and burning them to make carbon-14-free carbon dioxide that goes into the atmosphere, diluting the carbon-14 there. When we humans were busily blowing up atomic bombs in the atmosphere, they made a lot of carbon-14. Before we were so influential, changes in ocean circulation were probably most important—some carbon dioxide goes from atmosphere to ocean, and the ocean waters sink in certain places and spend a millennium or so down deep before coming back up to exchange carbon dioxide with the atmosphere. Because some of the carbon-14 from the atmosphere ends up decaying in the deep ocean, the ocean circulation actually reduces atmospheric radiocarbon—if water didn’t sink into the deep ocean, there would be less carbon-14 there and less carbon-14 decay there, and that would leave more carbon-14 in the atmosphere. At certain times in the past, less sinking of ocean waters seems to have occurred, allowing more carbon-14 to exist in the air.
The usual way to handle all of this is to use radiocarbon to date tree rings (which quit exchanging carbon with the atmosphere as soon as they grow) or shells in annually layered sediments, and use the layer-counted ages and the known half-life of radiocarbon to calculate the starting concentration of radiocarbon. Because radiocarbon is well-mixed in the atmosphere, and must have been well-mixed in the past, once a calibration curve is developed, it can be used for other samples. One can also date some samples, such as corals or cave formations, using accurate techniques such as uranium-series disequilibrium as well as using radiocarbon, and so obtain a calibration curve for the radiocarbon. Many different calibration studies have been conducted, and while they do not agree perfectly and research is ongoing, they agree reassuringly well. The biggest corrections are a bit more than 10%—a sample that looks to be 10,000 years old, assuming that there were no changes in radiocarbon concentration of the atmosphere, is actually about 11,500 years old, because the radiocarbon concentration of the atmosphere did change.
If you are primarily interested in the question “Does the world really look older than written records”, even radiocarbon provides a very good answer (“Yes, with very high scientific confidence”). Science has long since moved past that question, and the research frontier involves numerous fascinating questions, such as whether we can reconstruct changes in ocean circulation from the changing calibration of the radiocarbon clock after correcting for the changes in the sun and the magnetic field.
Plants actually have a slight preference for carbon-12 over carbon-13 or carbon-14 (the lighter atoms diffuse into the plant and react more easily), so the concentration of carbon-14 in a plant is slightly less than the concentration in the air. The preference for carbon-12 over carbon-13 is half as big as the preference for carbon-12 over carbon-14, so measuring the concentrations of all three types allows an accurate correction; this one is now easily done, and need not bother anyone much.
The 5000-year-old living clam raises a different but interesting issue. All of the discussion so far has assumed that the items being dated obtained their carbon from the atmosphere. But suppose that you “ate” only things that had been dead for a long time—you would not have much radiocarbon, and so you would look old to someone who assumed that you ate things containing normal concentrations of radiocarbon. Certain special ecosystems on the sea floor do just that; they live on natural oil seeps, eat the oil or eat things that ate the oil, and the oil is old and so lacks radiocarbon. If you were stupid enough to sample these and assume that they were eating “normal” foods, then you would mistakenly assume that the living creatures had been dead for a long time.
Such oil-seep ecosystems are quite rare and special. A more-common situation is a clam in a creek in a carbonate terrain. When caves are being made, the chemical equation for the water and carbon dioxide dissolving the rock is:
H2O+CO2+CaCO3→Ca+2 +2HCO3–The rain and atmospheric carbon dioxide on the left of the equation combine with the calcium carbonate of the limestone, yielding the calcium and bicarbonate ions on the right-hand side of the equation that are freed to wash down the creek. If a clam is making its CaCO3 shell from the water, the clam just runs this reaction backward. Notice, however, that half of the carbon, C, in the water came from the atmospheric CO2 and half from the rock. The rock is almost always very old, and has no radiocarbon. So, a clam in this situation would form a shell with only half as much radiocarbon as for a clam growing in a stream that does not drain carbonate rocks and that gets all of its carbon from the atmosphere. Hence, if scientists were clever with their instruments but stupid otherwise, those scientists might end up thinking that a living clam had been dead for over 5000 years.
Scientists are fully aware of this. For decades, however, there was a convention of reporting all radiocarbon measurements as the equivalent age assuming that the sample had been in equilibrium with the atmosphere. Dr. Alley is reasonably confident that the myth of the clam that was living yet the scientists thought it was thousands of years old came from work by a distinguished senior colleague, who almost 50 years ago published papers listing dates in the conventional fashion. That colleague actually was using the results to learn about the geochemistry of the waters. As noted above, some of the young-Earth-creationist websites have asked their supporters to “clam up” about this, because using it in an attempt to discredit scientists instead makes the young-Earth-creationists look confused.
Key Takeaways: Uniformitarianism and the Age of the Earth
Parsley, Sage, Rosemary and Time
- Aabsolute time”–how many years?
- Count annual layers, for accurate estimates, for “short times” (less than about 100,000 years);
- Calculate from recent rates and reconstructed effects, for less-accurate estimates, for short and long times (uniformitarian approach);
- Use radiometric (radioactive) techniques, for accurate estimates, for short and long times.
Annual layers
- Overlapping-tree rings, to more than 10,000 years;
- Special-lake sediments, to more than 40,000 years;
- Ice-core layers, to more than 100,000 years;
- MANY checks, including:
- reproducibility of counting,
- agreement with historical records (chemically fingerprinted fallout of volcanic eruptions, etc.),
- consistency amongst ice, lakes, and trees for ages of abrupt climate changes,
- agreement with radiometric, uniformitarian ages.
Old as the Hills
- Annual-layer records from geologically young materials (ice sheets, trees and lake sediments not turned to stone yet, on top of rocks) are much older than written history;
- Virtually all scientists agree Earth looks much older than written history;
Climbing the Canyon
- Metamorphosed old mountain range at the bottom;
- Unconformity, then two miles of sediments;
- Tipped by faulting, then unconformity, then another mile of sediments with several unconformities within;
- Rocks are “normal”, with tracks, mud cracks, etc., at many different levels, fossil changes upward;
Radiometric Dating
- Half of the parent atoms decay to offspring in one half-life (easy to measure; don’t need to wait for a half-life to pass, just for a measurable change);
- Half-life fixed by the same physics that make the sunshine and keep us from blowing up–is not a variable;
- Parent: offspring ratio plus half-life gives age;
- Agrees with written records, layer counts, uniformitarian calculations, other radiometric techniques.
0.0002 Inches and a Cloud of Dust
- Oldest rocks about 4 billion years old, but Earth bombarded, melted first;
- Meteorites formed with Earth; they are about 4.6 billion years old (agrees with whole-Earth estimates);
- If 4.6 billion years is the 100-yard length of a football field, written history is about the thickness of a sheet of paper, and a 20-year-old student has lived through 0.0002 inches.
