10 Chapter 10: Financial Modeling and Planning
Chapter 10: Financial Modeling & Planning
Basic Accounting for Entrepreneurs
As a new business is being developed, it’s important to think about the financials underlying your business model. This brings us to our discussion of two related concepts: financing and accounting. Although financing and accounting complement and rely on each other, they are distinct. Financing is the process of raising money, whereas accounting is the system that business owners use to summarize, manage, and communicate a business’s financial operations and performance. By recording and classifying financial transactions related to a business and summarizing those transactions in the form of financial statements, accounting is essentially documenting what happens to money once a company receives it. In this way, accounting provides a common language that allows business owners to understand and make decisions about their venture that are based on financial data. It also enables potential investors looking at multiple investment options to make easier comparisons and investment decisions.
At the most fundamental level, an accounting system accomplishes two goals:
- It summarizes a business’s financial performance
- It communicates that performance to owners, managers, and outside parties
The most common approach to accounting used in the United States, and around the world, follows the basic formula shown in Figure 10.1. This formula, referred to as the basic accounting equation, provides the foundation of a company’s financial status and outlook. First, we’ll define each of these terms, and then we’ll look at an example of a simple transaction recorded using the equation.
Figure 10.1 The Accounting Equation
 Attribution: Copyright Rice University, OpenStax, under CC BY 4.0 license
Assets are items, such as equipment, cash, supplies, inventory, receivables, buildings, and vehicles, that a business owns and derives future use from. Potential investors want to know what resources a company has at its disposal. Business owners want to see where their money has gone. As an example, let’s turn to the case of Shanti, a website designer who starts her business by purchasing a new laptop computer. The computer is an asset that Shanti has acquired for her business.
A liability is a debt that a company has incurred with another party, as when it borrows money from a bank or purchases materials from other suppliers. The business is required to make a future payment to satisfy that debt. For accounting purposes, we want to be able to see what the business owns (assets) compared with what it owes (liabilities). For example, if Shanti does not have sufficient cash to pay for the laptop, she may have the electronics store charge her credit card for the purchase. In that case, the credit card company pays the store, and Shanti’s business now owes the credit card company the amount of the purchase (i.e., a liability).
Equity is the owner’s claim on the assets of the business – that is, the difference between what they own and what they owe. Essentially, equity tells a business owner or investor how much the firm is worth after all the debt is repaid. Returning to the example of Shanti’s website design business, let’s compare two scenarios of startup purchases to see the effects on the accounting equation. In both cases, Shanti contributes some of her own money to the initial purchase of a laptop.
In the first scenario, shown in Figure 10.2, she contributes $1,000 to the new business. Each element of the accounting equation has its own account in an accounting system or software package, and all changes are tracked within its account. The accounting equation must stay in balance after every transaction with assets equaling liabilities. In this case, Cash is an assets account, and Owner’s Capital is an equity account. The $1,000 cash contributed is a cash asset and becomes equity that is recorded as owner’s capital. At this point, Shanti can claim 100 percent of the assets of the business, which right now consist only of the cash.
Figure 10.2 Recording a $1,000 owner contribution in the accounting equation

Attribution: Copyright Rice University, OpenStax, under CC BY 4.0 license
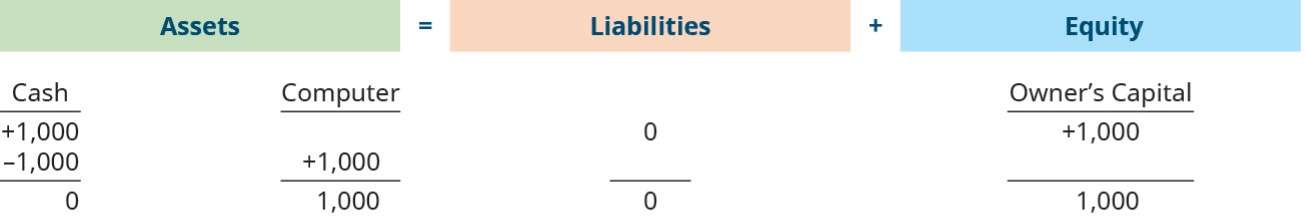
Next, if she uses all her cash assets to purchase the laptop, the accounting equation will record this as shown in Figure 10.3 below. When the cash is spent, reducing the assets column to zero, a new asset account for the computer is created to record the dollar amount paid for the laptop. Again, because Shanti doesn’t owe another party at the end of the transaction (because she didn’t make any additional contribution), the balance of the owner’s equity account remains the same. The equation shows that Shanti still owns 100 percent of the assets.
Figure 10.3 Recording the purchase of a laptop using existing cash
Attribution: Copyright Rice University, OpenStax, under CC BY 4.0 license
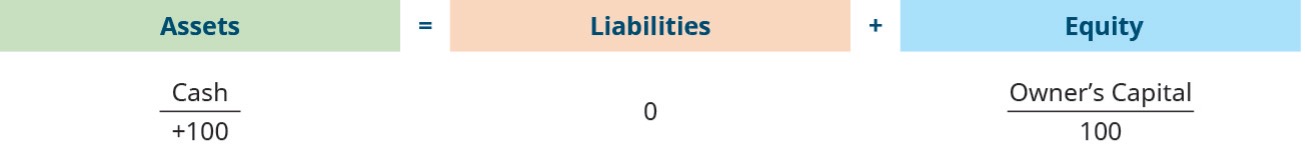
Now consider how to account for a situation in which Shanti does not have a significant amount of cash to contribute to the business. She can afford to contribute only $100 and deposits the money into the business’s bank account. Fortunately, she also has access to a credit card that can be charged for business purchases, increasing her investment options. The initial contribution to the business is recorded in the same way but with the new amount, as shown in Figure 10.4.
Figure 10.4 Recording a $100 owner contribution in the accounting equation
Attribution: Copyright Rice University, OpenStax, under CC BY 4.0 license
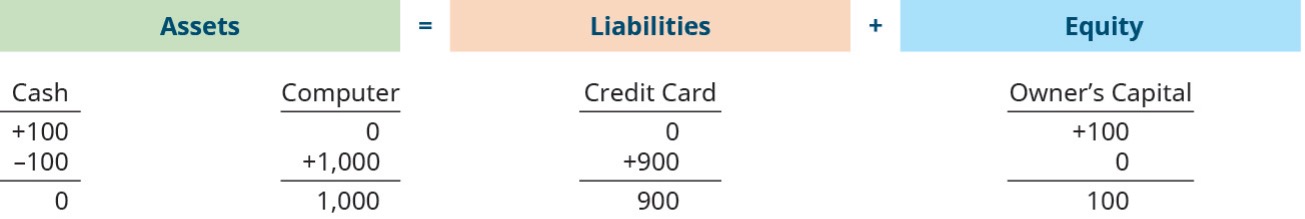
The laptop still costs $1,000, but the business has only $100 in cash assets. Shanti purchases the laptop with a credit card, and the clerk finalizes the sale. Figure 10.5 below shows the impact of the sale on the accounting equation.
Figure 10.5 Recording the purchase of a computer using cash and credit card
Attribution: Copyright Rice University, OpenStax, under CC BY 4.0 license
In both examples, Shanti reports the computer as an asset of the business that is valued at its $1,000 cost. In the first scenario, she exchanged the cash for the computer. In the second, she exchanged a smaller amount of cash for the laptop and charged the remaining amount of the purchase on a credit card. This creates a liability for the business that Shanti will need to repay in the future. Since this is an equation, both sides must be equal to each other, and this proves to be the case in both scenarios. The total assets are $1,000, and the total liabilities plus equity are also $1,000.
Exercise: Applying the Accounting Equation to Your Life
On a sheet of paper, use three columns to create your own accounting equation for your personal assets, liabilities, and expenses. In the first column, list all the things you own (assets). In the second column, list any amounts owed (liabilities). In the third column, using the accounting equation, calculate the net amount of the asset (equity). When finished, total the columns to determine your net worth.
Here is something else to consider: is it possible to have negative equity? It sure is – ask any college student who has had to take out loans. At first glance, there is no asset directly associated with the amount of the loan. But is that, in fact, the case? You may have asked yourself at some point, “Why should I make an investment in a college education? What is the benefit (i.e., asset) of going to college?” The answer lies in the difference in lifetime earnings that those with a college degree tend to accumulate in comparison to those without a college degree. This is influenced by many things, including the supply and demand of jobs and employees, and the field in which you plan to work.
Developing Startup Financial Statements and Projections
You have learned the basics about how an accounting system classifies transactions in terms of assets, liabilities, and equity; what those transactions mean in terms of the accounting equation; and what that information says about an entity’s overall financial health.
Now we’ll examine how to summarize those transactions in financial statements that can be shared with stakeholders. Internally, these statements are used to make decisions about the management of the company and its operations. Externally, they provide existing and potential investors with data to inform their financial support of the venture. The information entered into the accounting system is summarized in financial statements, which are the output of an accounting system. We will examine three basic types of financial statements:
- The balance sheet
- The income statement
- The statement of cash flows
Each type of statement communicates specific information to its audience. Investors around the world use financial statements every day to make investment decisions.
Additional Resources
If you like quizzes, crossword puzzles, fill-in-the-blanks, matching exercises, or word scrambles, go to My Accounting Course for some fun ways to reinforce the accounting information you are learning. This website covers a variety of accounting topics including financial accounting basics and financial statements.
The Balance Sheet
The first financial statement is the balance sheet. The balance sheet summarizes the accounting equation and organizes the different individual accounts into logical groupings. As you previously learned, the components of the accounting equation are:
- Assets: Items the company owns or will benefit from (examples include cash, inventory, and equipment)
- Liabilities: Debt or amounts the company must repay in the future (examples include credit card balances, loans payable, and so on)
- Equity: The share of the assets due to the owners after debt is repaid
The accounting equation itself (assets = liabilities + equity) is spelled out on the balance sheet. It is shown in two portions. On one side, all of the assets are spelled out and their amounts totaled. This total is compared to the totals in the second and third portions, which show liabilities and equity. Just as the accounting equation itself must balance, so must the balance sheet.
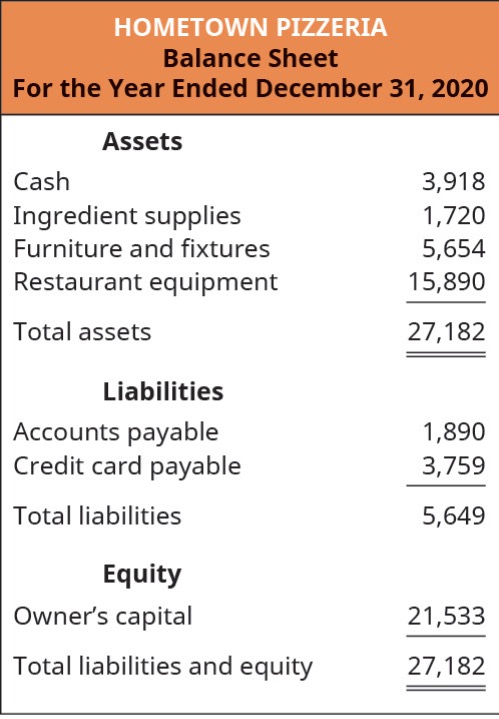
Figure 10.6 below shows the 2020 balance sheet for Hometown Pizzeria. This is the same kind of financial statement that real-life investors use to learn about a business. You can see the main aspects of the accounting equation in each half of the statement, as well as many detailed individual accounts. This financial statement gives the reader a quick summary of what the company owns and what it owes. A potential investor will be interested in both. The amount of liabilities is an indicator of how much the business needs to pay off before the investors will see a return on their investment.
Unlike the accounting equations shown in the previous section, most balance sheets display data vertically rather than horizontally. But the vertical format still presents the two sides of the equation – except that liabilities and equity appear on the bottom half of the statement. Note that the two sides still must equal each other, or “balance” – hence the name “balance sheet.”
Figure 10.6 Hometown Pizzeria’s Balance Sheet
Attribution: Copyright Rice University, OpenStax, under CC BY 4.0 license
A review of Hometown Pizzeria’s balance sheet lets us see what kind of assets the company has. We see cash, ingredients, and restaurant equipment – all things that would be necessary to make pizzas and sell them. We also see some liabilities. Accounts payable is an account that covers many different vendors that the company buys from on credit, which means the vendors let the pizzeria pay them after they have delivered their goods. These vendors could include companies that sell flour, produce, or pizza boxes. Credit card payable is the balance due on the credit card, which could have also been used to stock up on supplies or pay other bills.
One of the first things an investor will do is compare the total assets of a company with the total liabilities. In this case, the pizzeria reports total assets of $27,182 and total liabilities of $5,649. This means that the pizzeria owns more than it owes, which is a good sign. It actually has several times more assets than liabilities. Although it does not have enough cash to pay off all the liabilities right now, other assets have value and could be sold to generate cash.
To recap, the balance sheet summarizes the accounting equation. It tells the business owner what the company has and how it was paid for. Investors also want to understand where the company has spent its money and where that money came from. If a company is laden with debt, any investment may be immediately spent trying to get caught up with creditors, with no real impact on helping operations. Ultimately, investors want to read these financial statements to know how their money will be used.
The Income Statement
The second basic financial statement is the income statement, which provides the results of a company’s operations. At the most basic level, the income statement, also called the profit-and-loss statement, describes how much money the company earned while operating the business and what costs it incurred while generating those revenues. An investor wants to know how much money the company brought in from customers and how much it had to spend to get those customers. Revenue minus expenses results in net income, or profit if there are funds left over.
After identifying total revenue and expenses, a business can calculate its profit margin. The profit margin is the profit divided into the total revenue, described as a percent. For example, if we opened a pizzeria and generated $100,000 in sales our first year and incurred $90,000 in expenses, that would result in $10,000 of net income. If we divide that net income by our $100,000 in sales, the profit margin is 10 percent. So for every dollar of sales that was generated, ten cents remained as a profit. We could save this resulting profit for future renovations, an expansion, or payment to the owners as a distribution.
A pizzeria (or any business that sells a physical product) has costs that are specific to the product sold. For example, pizza requires flour and yeast to make the dough, tomato sauce, and cheese and other toppings. We refer to these expenses as the cost of goods sold. These costs are the primary driver that determines whether the company can be profitable. If the selling price of a pizza is $12 and our cost of ingredients is $12, the transaction nets to zero. The company wouldn’t make any money on a sale and is simply recouping the money paid for the ingredients. This is not a feasible business model because there are many costs in addition to ingredients, such as rent on the building, employee wages, and other items.
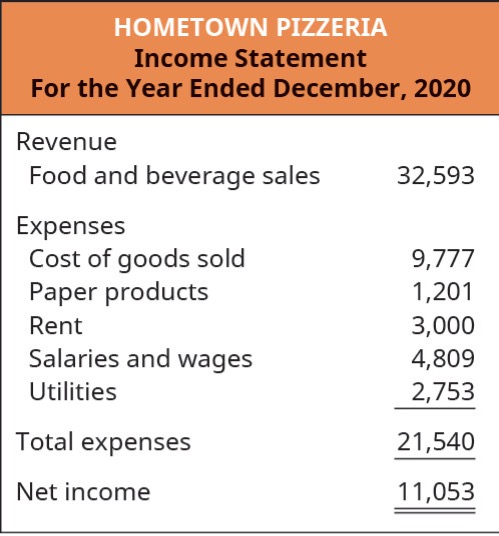
The selling price of an item minus its direct costs (or cost of goods sold) is the gross profit. In a product business, this is the most important operational figure. A business needs to know how much money it makes on each sale because that gross profit pays for all other expenses. If the pizzeria sells a pizza for $12, the cost of its ingredients might be $4, so the gross profit of selling one pizza is $8. Every time the company sells another pizza, the gross profit increases. If the business sells 1,000 pizzas in a month, its sales would be $12,000, the cost of goods sold would be $4,000, and $8,000 would be left for profit (see Figure 10.7).
Figure 10.7 Hometown Pizzeria’s Income Statement
Attribution: Copyright Rice University, OpenStax, under CC BY 4.0 license
Recording Results from Operations
A business can create assets through debt or equity financing (i.e., taking out loans and/or receiving investment). After the initial acquisition of key assets, those assets can be employed to operate the business. For example, when Hometown Pizzeria opens, after the initial build out of the kitchen and dining area, the business can make and serve food to customers in exchange for money. This process creates new assets in the form of cash collected from customers and becomes a third way to generate assets in a business – from revenue-generating operations. In an ideal situation, the business would require little outside investment once operations have begun.
The amount that a business earns from selling a product or providing a service is referred to as revenue, or sales. The costs incurred in the normal course of operations are referred to as expenses. For the newly opened pizzeria, payments from customers for their meals are the business revenue, whereas the cost of food ingredients, beverages, dinnerware, and paper goods (such as napkins) are the operating expenses. The balance of business revenue minus operating expenses is the profit of the business, or net income.
Before moving on to visualizing operational income, let’s pause here to review some of the basic distinctions between these key terms. When a company gains new assets, those assets have to come from somewhere, usually from one of three sources. We see these options on the right side of the equation, as we move from left to right.
First, if we gain a new asset, but we have not paid for it, we have created a liability – something the business owes. This was the case when Shanti paid for her computer with a credit card. In the future, she will have to pay the credit card company, but this is a different process from an expense. For right now, we are gaining something new and must repay someone later.
The second source of new assets is owner investments. This was the first example we saw when Shanti deposited money in the business’s bank account from her personal savings. In terms of the business, assets increased because she now had more cash than before, and on the right side of the accounting equation, we record the source of those assets – Shanti herself. So, investments by the owner are another source of new assets.
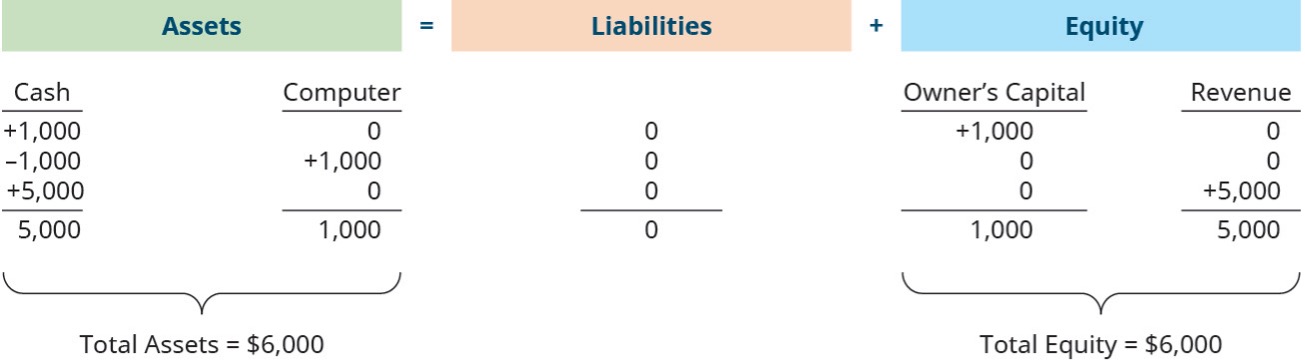
The third way that the business gains new assets is from operations. When Shanti uses the assets of her business (a computer) to perform work for a customer (e.g., creating a website), this results in a sale, or revenue. Assets of the business increase because the customer pays for the work; in turn, Shanti’s cash increases. Again, on the right side of the equation, we record the source of that asset: revenue. Revenue is an increase in assets from customers paying for goods and services. To illustrate, let’s continue with Shanti’s website design business. She purchased a computer with her personal savings and has been hired to create a website for a local business. This client agrees to pay $5,000 for the website, due on completion of the site. Once the work on the website is complete, Shanti records the receipt of $5,000 cash as an increase to the cash account. On the right side of the equation in Figure 10.8, this is added in an account under equity for revenue.
Figure 10.8 Recording a customer sale of $5,000
Attribution: Copyright Rice University, OpenStax, under CC BY 4.0 license
The total company assets have grown to $6,000 with the addition of the $5,000 earned and collected from this client. On the right side of the equation, equity has increased in a new column representing revenue and expenses, where revenues are positive amounts and expenses are negative amounts.
The accounting equation describes how transactions are classified within the context of balancing what a business has (assets) with how it paid for those assets (liabilities and equity). In the next section of this chapter, we will explore how this information is summarized in financial statements and how entrepreneurs and potential investors use that information.
The Statement of Cash Flows
The third basic financial statement we will discuss is the statement of cash flows, which explains the sources of and uses of a company’s cash. You may wonder how the statement of cash flows differs from an income statement. The short answer is that the income statement captures events as they happen, not necessarily when the company gets paid. It records certain items, such as sales, when the work is completed.
Let’s return to Shanti, the website designer. As soon as she completes the client’s website, the accounting system will record the revenue, the amount that is due from that client; this second item is referred to as accounts receivable. If Shanti’s client is struggling financially or even goes out of business, she may never get paid for that work, but the income statement would show sales, and therefore possibly a profit. If the customer goes out of business, the business bank account will not have any evidence of a profit.
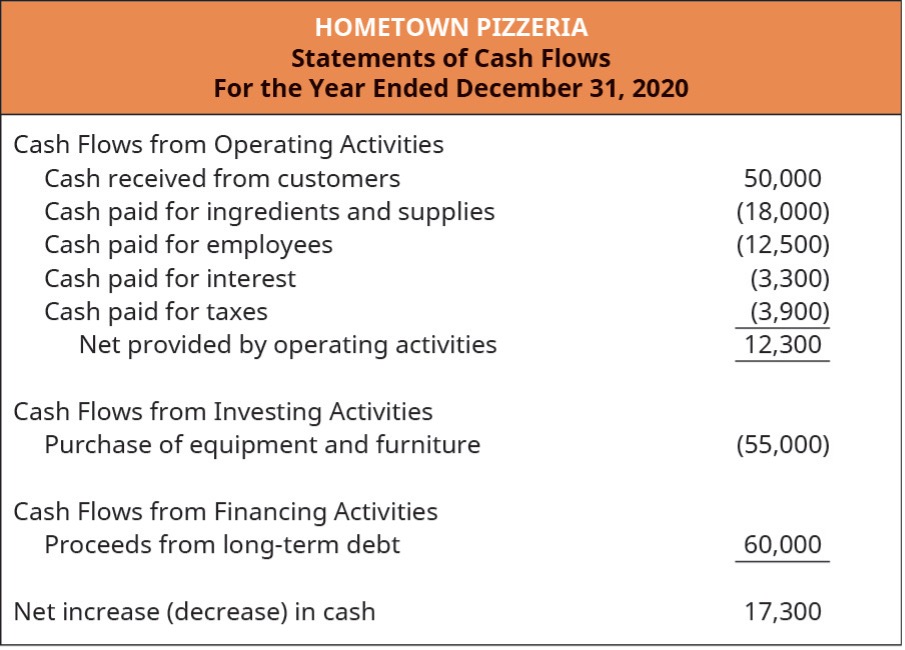
It is for this reason that the statement of cash flows was developed. It accounts for these differences, only showing activities that result in cash received or cash paid. To better understand the purpose and use of the statement of cash flows, let’s first look at this statement again in the context of a pizzeria (see Figure 10.9 below).
Figure 10.9 Hometown Pizzeria’s Statement of Cash Flows
Attribution: Copyright Rice University, OpenStax, under CC BY 4.0 license
As we can see in the statement of cash flows for Hometown Pizzeria, although the basic operations generate positive cash flow, a major purchase was required. This is common at the inception of a business. Not every location will come equipped with a commercial kitchen and dining area, so the business may need to purchase items such as a pizza oven and dining chairs and tables. Note that although the income statement approximates the cash flow from operations, it would not show the large outflow resulting from the initial purchase of equipment. That purchase would have been treated as an asset within the context of the accounting equation and would have been recorded on the balance sheet. So from that large difference alone, we can see why some people say that the statement of cash flows is the most important of the financial statements. It bridges the gap between the income statement and the balance sheet.
As you can see in the figure, the statement of cash flows is broken into three sections. The first is operating activities, the day-to-day activities of the business, including purchasing supplies, paying rent, and receiving cash from customers. This section tells a reader how effective the company’s business model is at generating cash flow.
Investing activities include major purchases of equipment or facilities. For example, when the pizzeria purchased equipment and furniture, the $55,000 spent were recorded as investing activities. Additionally, if a company has an excess of cash, it may purchase securities such as stocks and bonds, which have a higher return on investment than a traditional bank savings account. This section tells a reader where the company spends money in terms of large acquisitions.
The third section of the statement of cash flows is financing activities. This section tells a reader where new infusions of cash come from. The owners of Hometown Pizzeria need to find a way to pay for the kitchen equipment and furniture. If they have such an amount in their personal savings, then they can simple contribute it to the company themselves. If they don’t have the money already, they will need to seek other sources, such as loans or the types of investors that will be discussed further in the next chapter. Generally, any financing activity is also booked in the balance sheet as well.
This financing activities section of the statement explains which sources the owners used to generate outside funds coming into the business. It always indicates future requirements as well. For example, if a bank loaned the pizzeria the money, then we know it will have to be repaid in the future – so the business will need to ensure it is setting aside money to make monthly repayments. If new investors contribute money, what manner of return on investment will they be seeking? If they decide to seek regular distributions of profit, they will have to factor that in.
Financial Projections
Among the most powerful tools business owners can use are financial projections. A projection is a forecast of the future operations of the business. It is a landscape for the business: What do the next few months look like? What about the next year? A projection would outline what level of payments are expected to come in and the timing of costs incurred. This lets the business owner understand what potential financing needs to be secured.
Two key concepts related to projections are the run rate and burn rate. The run rate helps extrapolate into the future. For example, if the pizzeria is generating sales of $10,000 per month, that translates into an annual run rate of $120,000 per year. Multiplying the monthly amount by twelve tells us the annual amount; if we wanted quarterly projections, we would multiply the monthly amount by three. This is useful for explaining to investors what the company will look like now that it has achieved traction in generating sales.
The burn rate is the rate at which cash outflow exceeds cash inflow, or essentially how much money the company is expending overall each month. Before generating revenue, or generating enough to just break even, startup companies will incur losses. Understanding the pace at which the expenses exceed revenue helps business owners plan accordingly. For example, if it takes six months to renovate the pizzeria and the monthly rent is $2,000, then the burn rate is $2,000 per month and forecasts that the business will need an additional $12,000 ($2,000 × six months) available in financing on top of the cost of renovations. The location’s rent must be paid, even if the pizzeria isn’t yet open for business.
During the earliest (or seed) stage of a new business, projections can also be used to show potential investors how quickly the company will make money and hopefully inspire them to invest in the venture. Just as on Shark Tank, projections are used during the “pitch.” Investors and lenders want to see exactly how they can expect the business to perform and how quickly the company generates positive financial results.
Break-Even Analysis
Another critical part of planning for new business owners is to understand the breakeven point, which is the level of operations that results in exactly enough revenue to cover costs. It yields neither a profit nor a loss. To calculate the break-even point, you must understand the behavior of two different types of costs: variable and fixed.
Variable costs fluctuate with the volume of sales. Returning to Hometown Pizzeria, we see that the cost of ingredients would be a variable cost – because the more pizzas you make, the more ingredients you will need. In a previous section, we also referred to these as the cost of goods sold. Variable costs are based on the number of pizzas sold, with the goal being to buy just enough ingredients that the business doesn’t run out of supplies or incur spoilage. In this example, the cost of making a pizza is $4, so the total variable costs in any given month equal $4 times the number of pizzas made.
Variable costs differ from fixed costs, which are a set amount each month and do not change, regardless of the volume of items sold and revenue generated. For example, rent is a fixed cost for the pizzeria, regardless of whether it sells any pizzas or not. In fact, most of the business’s other costs operate in this manner as well. Although some costs vary from month to month, costs are described as variable only if they will increase if the company sells even one more item. Costs such as insurance, wages, and office supplies are typically considered fixed costs.
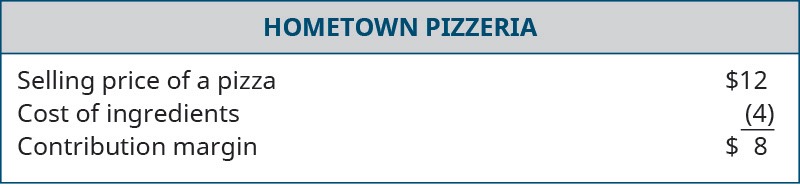
The first step in understanding the break-even point is to calculate the contribution margin of each item sold. The contribution margin, or the gross profit from a single item sold, is calculated by subtracting variable costs from an item’s selling price (i.e., Selling Price – Variable Cost = Contribution Margin).
Hometown Pizzeria’s selling price of a pizza is $12. The variable cost is $4, so this results in a contribution margin of $8 per pizza ($12 – $4 = $8). See Figure 10.10 below. This $8 contribution margin will go toward paying other (fixed) expenses. When all fixed costs have been covered, the business will break even, and any additional revenue is added to profit. Once we understand how much each item sold contributes to other expenses, we understand how those other costs behave.
Figure 10.10 Hometown Pizzeria’s Contribution Margin
Attribution: Copyright Rice University, OpenStax, under CC BY 4.0 license)
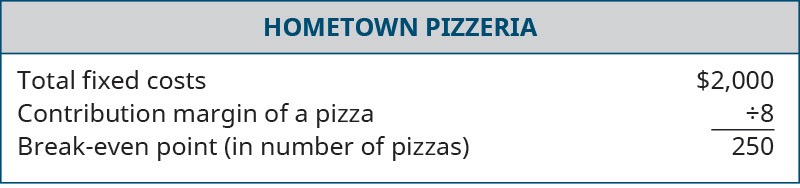
Once variable and fixed costs are determined, this information can be used to produce a break-even analysis. Calculating the break-even point is simply a matter of dividing the total fixed costs by the contribution margin. In other words,
Break-even point = Total Fixed Costs / Contribution Margin
= Total Fixed Costs / (Selling Price – Variables Costs)
To illustrate, let’s assume that Hometown Pizzeria still sells pizzas with a contribution margin of $8 each. Let’s also assume that the only fixed cost is the rent of $2,000 per month. If we wanted to know how many pizzas the owner needs to sell each month to pay the rent, we divide $2,000 by $8. This results in a break-even point of 250 pizzas (see Figure 10.11). Now we know that if the pizzeria sells 250 pizzas a month, its rent is completely paid. Any additional pizzas sold add to the company’s profit. If the business sells fewer than 250 pizzas, it will not generate enough income to cover the rent and will incur a loss. Whenever a business incurs a loss, the owners will need to contribute more of their own personal savings or potentially go into debt.
Figure 10.11 Hometown Pizzeria’s Break-even Point
Attribution: Copyright Rice University, OpenStax, under CC BY 4.0 license
Understanding the break-even point for a business provides a great deal of insight. At the most basic level, it demonstrates how many units of a product must be sold to cover the expenses of the business and not incur a loss. It may also help business owners understand when costs are too high and decide how many units need to be sold to break even. Realizing this up front can help entrepreneurs avoid starting a business that will result only in losses.
Exercise: Calculating Break-Even Point
Consider the break-even analysis tool. Using the same contribution margin provided above ($8/pizza), calculate a new break-even point if we chose to locate the business in a more expensive city. How many pizzas would we need to sell if our fixed costs were $5,000 a month? What if they were $10,000 a month?
Pricing Strategies
As you saw in the previous sections, selling price has a clear impact on the viability of a business. Businesses rely on price to cover the cost of production, to pay expenses, and to provide the profit incentive necessary to continue to operate the business. We might think of these factors as helping a business to: (a) survive, (b) earn a profit, (c) generate sales, (d) secure an adequate share of the market, and (e) gain an appropriate image.
- Survival: It is apparent that most owners wish to pursue strategies that enable their businesses to continue in operation for the long term. So survival is one major objective pursued. In a for-profit company, the price paid by the buyer generates revenue for the business. If revenue falls below cost for a long period of time, the business cannot survive.
- Profit: Survival is closely linked to profitability. For example, making a $500,000 profit during the next year might be a pricing objective for a firm; anything less might entail failure. All business enterprises must earn a long-term profit. For many businesses, long-term profitability also allows the business to satisfy their investors. Lower-than-expected or no profits may prove disastrous for the company.
- Sales: Just as survival requires a long-term profit for a business, profit requires sales. When running a business, it is critical to generate and manage demand. Demand must be managed to regulate exchanges or sales.
- Market share: Leaders of firms both large and small may be concerned with maintaining an adequate share of the market so that their sales volume will enable the firm to survive and prosper. (If the sales of Safeway Supermarkets in the Dallas-Fort Worth metropolitan area of Texas account for 30 percent of all food sales in that area, we say that Safeway has a 30 percent market share.) Again, pricing strategy is one of the tools that is significant in creating and sustaining market share. Prices must be set to attract the appropriate market segment in significant numbers.
- Image: Price policies play an important role in affecting a business’s position of respect and esteem in its community. Price is a highly visible communicator. It can convey the message to the community that the business offers good value, that it is fair in its dealings with the public, that it is a reliable place to patronize, and that it stands behind its products and services.
Developing a Pricing Strategy
While pricing a product or service may seem to be a simple process, it is not. Good pricing strategy is usually based on sound assumptions. Pricing may prove unsuccessful unless the business adopts the consumer’s perspective toward price. Similarly, a company should not charge high prices if it hurts society’s health. While different data and analysis can be used to help with the process of pricing, the decision itself involves a bit of guesswork. Thus, establishing a price point for a new product or service likely requires some of the testing and experimenting explored in the previous chapter.
Pricing decisions can be based on various factors, including cost, demand, competition, value, or some combination of factors. For purposes of discussion, we categorize the alternative approaches to determining price as follows: (a) cost-oriented pricing; (b) demand-oriented pricing; and (c) value-based approaches.
Cost-oriented Pricing: Cost-plus and Mark-ups
The cost-plus method, sometimes called gross margin pricing, is perhaps most widely used to set price. The entrepreneur selects as a goal a particular gross margin that will produce a desirable profit level. Gross margin is the difference between how much the goods cost and the actual price for which it sells. This gross margin is designated by a percent of net sales.
A primary reason that the cost-plus method is attractive is that it does not require forecasting general business conditions or customer demand. If sales volume projections are reasonably accurate, profits will be on target. Customers may also view this method as fair, since the price they pay is related to the cost of producing the item. Likewise, the business is sure that costs are covered.
A major disadvantage of cost-plus pricing is its inherent inflexibility. For example, department stores have often found difficulty in meeting competition from discount stores, catalog retailers, or furniture warehouses because of their commitment to cost-plus pricing. Another disadvantage is that it does not consider customers’ perceptions of a product’s value. Finally, a company’s costs may fluctuate, and constant price changing is not a viable strategy.
A related concept is the term mark-up, which refers to the difference between the average cost and price of all products for a particular business, or for an individual product. This difference may be expressed in dollars or as a percentage. For example, if a man’s tie costs $4.60 and is sold for $8, the dollar mark-up is $3.40. The mark-up may be designated as a percent of selling price or as a percent of cost of the merchandise. In this example, the mark-up is 74% of cost ($3.40/$4.60) or 42.5% of the selling price ($3.40/$8).
Although this pricing approach may seem overly simplified, it has definite merit. The problem facing owners of certain types of businesses (e.g., retail food stores) is that they must price a very large number of items and change many of those prices frequently. The standard mark-up usually reflects historically profitable margins and provides a good guideline for pricing.
Certainly, costs are an important component of pricing. No business can make a profit until it covers its costs. However, the process of determining costs and then setting a price based on costs does not take into consideration what the customer is willing to pay at the marketplace. As a result, many companies that have set out to develop a product have fallen victim to the desire to continuously add features to the product, thus adding cost. When the product is finished, these companies add some percentage to the cost and expect customers to pay the resulting price. These companies are often disappointed, as customers are often not willing to pay this cost-based price.
Demand-oriented Pricing
Demand-oriented pricing focuses on the nature of the demand curve for the product or service being priced. The nature of the demand curve is influenced largely by the structure of the industry in which a business competes. That is, if a business operates in an industry that is extremely competitive, price may be used to some strategic advantage in acquiring and maintaining market share. On the other hand, if the business operates in an environment with a few dominant players, the range in which price can vary may be minimal.
Value-based Pricing
If we consider the three approaches to setting price, cost-based is focused entirely on the perspective of the company with very little concern for the customer; demand-based is focused on the customer, but only as a predictor of sales; and value-based pricing focuses entirely on the customer as a determinant of the total price/value package. Businesses that employ value-based pricing might use the following definition: “It is what you think your product is worth to that customer at that time.” Moreover, it acknowledges several pricing truths:
- To the customer, price is the only unpleasant part of buying.
- Price is the easiest marketing tool to copy.
- Price represents everything about the product.
Still, value-based pricing is not altruistic. It asks and answers two questions : (a) what is the highest price I can charge and still make the sale? and (b) am I willing to sell at that price? The first question must take two primary factors into account: customers and competitors. The second question is influenced by two more: costs and constraints. Let us discuss each briefly.
Many customer-related factors are important in value-based pricing. For example, it is critical to understand the customer buying process. How important is price? When is it considered? How is it used? Another factor is the cost of switching. Have you ever watched the television program “The Price is Right”? If you have, you know that most consumers have poor price knowledge. Moreover, their knowledge of comparable prices within a product category (e.g., ketchup) is typically worse. So price knowledge is a relevant factor. Finally, the marketer must assess the customers’ price expectations. How much do you expect to pay for a large pizza? Color TV? DVD? Newspaper? Swimming pool? These expectations create a phenomenon called “sticker shock,” as exhibited by gasoline and automobiles.
A second factor influencing value-based pricing is competitors. Defining competition is not always easy. Of course, there are like-category competitors such as Toyota and Nissan. It is possible to consider pricing above, below, and at the same level of these direct competitors. However, there are also indirect competitors that customers may use to base price comparisons. For instance, we may use the price of a vacation as a basis for buying vacation clothes. The cost of eating at a restaurant is compared to the cost of groceries. There are also instances when a competitor, especially a market leader, dictates the price for everyone else. Weyerhauser determines the price for lumber. Kellogg establishes the price for cereal.
If you are building a picnic table, it is fairly easy to add up your receipts and calculate costs. For a more complex product or service, determining costs can be a great deal more complicated. For example, calculating incremental costs and identifying avoidable costs are valuable tasks. Incremental cost is the cost of producing each additional unit. If the incremental cost begins to exceed the incremental revenue, it is a clear sign to quit producing. Adding costly features to a product that the customer cannot use is an example of this. Avoidable costs are those that are unnecessary or can be passed onto some other player in the value chain (e.g., supplier, customer, middlemen, etc.). For example, the banking industry has passed certain costs of transactions (e.g., ATM fees) onto customers. Another consideration is opportunity costs. For example, because a company spent money on store remodeling, it may not be able to take advantage of a discounted product purchase. Finally, costs vary from market-to-market as well as quantities sold. Research should be conducted to assess these differences.
Although it would be nice to assume that a business has the freedom to set any price it chooses, this is not always the case. There are a variety of constraints that prohibit such freedom. Some constraints are formal, such as government restrictions in respect to strategies like collusion and price-fixing. This occurs when two or more companies agree to charge the same or very similar prices. Other constraints tend to be informal. Examples include matching the price of competitors, a traditional price charged for a particular product, and charging a price that covers expected costs.
Ultimately, value-based pricing offers the following three tactical recommendations:
- Employ a segmented approach toward price, based on such criteria as customer type, location, and order size.
- Establish the highest possible price level and justify it with comparable value.
- Use price as a basis for establishing strong customer relationships.
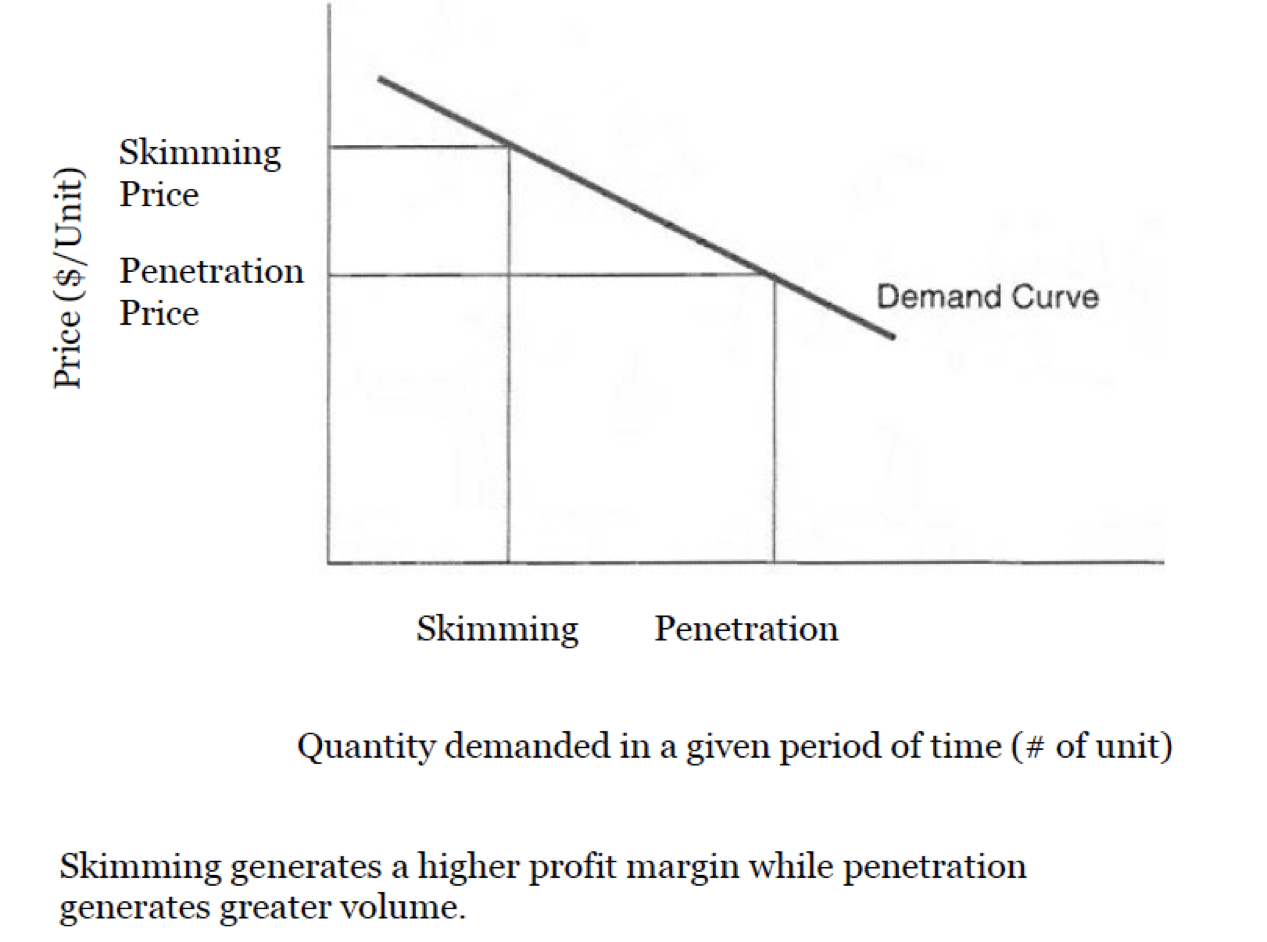
Penetration and Skimming Pricing
Penetration pricing is usually used in the introductory stage of a new product’s life cycle, and involves accepting a lower profit margin and to price relatively low. Such a strategy should generate greater sales and establish the new product in the market more quickly. Price skimming involves the top part of the demand curve. Price is set relatively high to generate a high profit margin and sales are limited to those buyers willing to pay a premium to get the new product (see Figure 10.12 below).
Figure 10.12 Penetration and Skimming Pricing on the Demand Curve
Penetration pricing can be used to achieve market share as a competitive strategy to achieve market leadership. Other times, it can also be used to increase market and sales growth. For example, when Sony was developing the Walkman in 1979, a retail price of ¥50,000 ($249) was required to achieve breakeven. However, a price of ¥35,000 ($170) was needed to attract the youth market segment. Although a breakeven price of ¥40,000 was achieved after a long process of cost cutting, Chairman Akio Morita insisted on a retail price of ¥33,000 ($165) to commemorate Sony’s 33rd anniversary. Sony also used this approach when its camcorder market became experienced price competition from Samsung, Hitachi and Panasonic. Google’s penetration pricing strategy provides another example; it initially offered its Google Checkout service at a break-even price or at a loss to gain market share against Paypal.
Which strategy is best depends on a number of factors. A penetration strategy would generally be supported by the following conditions: price-sensitive consumers, opportunity to keep costs low, the anticipation of quick market entry by competitors, a high likelihood for rapid acceptance by potential buyers, and an adequate resource base for the firm to meet the new demand and sales.
A skimming strategy is most appropriate when the opposite conditions exist. A premium product generally supports a skimming strategy. In this case, “premium” does not just denote high cost of production and materials; it also suggests that the product may be rare or that the demand is unusually high. An example would be a $500 ticket for the World Series or an $80,000 price tag for a limited-production sports car. Having legal protection via a patent or copyright may also allow for an excessively high price. Intel and their Pentium chip possessed this advantage for a long period of time. In most cases, the initial high price is gradually reduced to match new competition and allow new customers access to the product.
A skimming strategy may also be used when the company is the only supplier of a new or innovative product, to maximize profits until competition forces a lower price. Several electronic products that were very innovative during their introduction (e.g., DVRs, flat screen TVs, etc.) were priced very high during the initial introduction phase, and then the prices dropped steeply. This strategy can also be used when a product market has only two income levels: the super-rich and the very poor. For example, when Johnson & Johnson priced their diapers in Brazil before the arrival of P&G, the company’s cost structure did not allow the setting of a low enough price for the low-income segment. In these cases, a company will typically cater to the wealthier segment using a premium price.
