19 How to Create a Bar Graph in Excel
By Ricardo Beltran
How to Create a Bar Graph in Excel
- Open Excel
- Enter the data in the columns (one column for words, one column for numbers
- Highlight the data
- Go to “Insert”
- Click on the bar graph icon
- Click on “2D’
- The Bar Graph appears
- On the right hand side of the graph, a boxed + will appear (as shown below). Click on it
- A list will appear. Click on axis titles, chart title, data labels (optional) grid lines
- Type the names of these items in the text box that appears on the graph
Copy the chart to Word
- Once you finalize your graph, click on it
- Copy it (control-C, or right click and select copy)
- Open a Word document
- Paste the bar graph into the Word document (Control -V, or right click and select paste)
- Format the figure properly in your chosen citation style, making note of where titles, labels, and captions/notes belong.
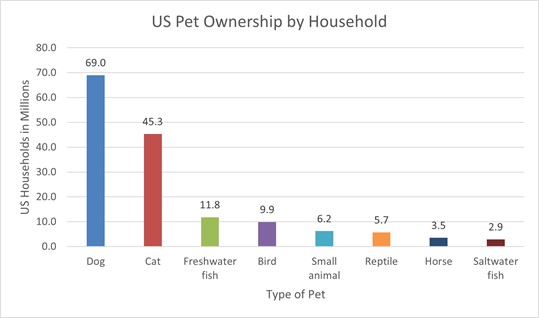 Fig 1. The data on pet ownership is from a 2021-2022 survey by the American Pet Products Association.
