3 Fractions, Decimals, Percents
Topics Covered:[1]
Fraction Basics
A fraction is a way to represent parts of a whole. The fraction  represents two of three equal parts. In the fraction , the 2 is called the numerator and the 3 is called the denominator. The line is called the fraction bar.
 of the circle is shaded -2 of the 3 equal parts.
A fraction is written  , where b ≠ 0 and
a is the numerator and b is the denominator.
A fraction represents parts of a whole. The denominator b is the number of equal parts the whole has been divided into, and the numerator a indicates how many parts are included.
Fractions that have the same value are equivalent fractions.
The Equivalent Fractions Property allows us to find equivalent fractions and also simplify fractions.
If a, b, and c are numbers where b ≠ 0, c ≠ 0,
then  =
=  and
and 
A fraction is considered simplified if there are no common factors, other than 1, in its numerator and denominator.
For example,
is simplified because there are no common factors of 2 and 3.
 is not simplified because 5 is a common factor of 10 and 15.
We simplify, or reduce, a fraction by removing the common factors of the numerator and denominator. A fraction is not simplified until all common factors have been removed. If an expression has fractions, it is not completely simplified until the fractions are simplified.
Sometimes it may not be easy to find common factors of the numerator and denominator. When this happens, a good idea is to factor the numerator and the denominator into prime numbers. Then divide out the common factors using the Equivalent Fractions Property.
Try it!
Simplify: 
Solution
Solution (click to reveal)
| Steps | Algebraic |
|---|---|
| Step 1. Rewrite the numerator and denominator to show the common factors. If needed, use a factor tree.
Rewrite 315 and 770 as the product of the primes. |
|
| Step 2. Simplify using the equivalent fractions property by dividing out common factors.
Mark the common factors 5 and 7. Divide out the common factors |
|
| Step 3. Multiply the remaining factors, if necessary. |  |


Simplify: 
Solution
Solution (click to reveal)

We now summarize the steps you should follow to simplify fractions.
How to simplify a fraction.
- Rewrite the numerator and denominator to show the common factors.
If needed, factor the numerator and denominator into prime numbers first. - Simplify using the Equivalent Fractions Property by dividing out common factors.
- Multiply any remaining factors.
Multiply and Divide Fractions
Many people find multiplying and dividing fractions easier than adding and subtracting fractions.
To multiply fractions, we multiply the numerators and multiply the denominators.
Fraction Multiplication
If a, b, c, and d are numbers where b ≠ 0, and d ≠ 0, then:
![\[\displaystyle\frac{a}{b} \boldsymbol{\cdot} \frac{c}{d} = \frac{ac}{bd}\]](https://utsa.pressbooks.pub/app/uploads/quicklatex/quicklatex.com-cb0c84601cd641839814e1eda29044cb_l3.png "Rendered by QuickLaTeX.com")
To multiply fractions, multiply the numerators and multiply the denominators.
When multiplying fractions, the properties of positive and negative numbers still apply, of course. It is a good idea to determine the sign of the product as the first step. In the next example, we will multiply a negative and a positive, so the product will be negative.
When multiplying a fraction by an integer, it may be helpful to write the integer as a fraction. Any integer, a, can be written as  . So, for example,
  .
.
Try it!
Multiply: 
Solution
Solution (click to reveal)
The first step is to find the sign of the product. Since the signs are the same, the product is positive.
| Steps | Algebraic |
| Example |  |
| Determine the sign of the product. The signs are the same, so the product is positive.. |  |
| Write 20x as a fraction. |  |
| Multiply. |  |
| Rewrite 20 to show the common factor 5 and divide it out. |  |
| Simplify. |  |
Multiply: 
Solution
Solution (click to reveal)
−33a
Multiply: 
Solution
Solution (click to reveal)
Now that we know how to multiply fractions, we are almost ready to divide. Before we can do that, we need some vocabulary. The reciprocal of a fraction is found by inverting the fraction, placing the numerator in the denominator and the denominator in the numerator. The reciprocal of is  . Since 4 is written in fraction form as
  , the reciprocal of 4 is
  .
.
To divide fractions, we multiply the first fraction by the reciprocal of the second.
Fraction Division
If a, b, c, and d are numbers where b ≠ 0, c ≠ 0, and d ≠ 0, then
![\[\displaystyle\frac{a}{b}\div\frac{c}{d} = \frac{a}{b}\cdot\frac{d}{c}\]](https://utsa.pressbooks.pub/app/uploads/quicklatex/quicklatex.com-8a077286cbac451f2af9a21b5cf851c6_l3.png "Rendered by QuickLaTeX.com")
To divide fractions, we multiply the first fraction by the reciprocal of the second.
We need to say b ≠ 0, c ≠ 0, and d ≠ 0, to be sure we don’t divide by zero!
Try it!
Find the quotient: 
Solution
Solution (click to reveal)
| Steps | Algebraic |
| Example |  |
| To divide, multiply the first fraction by the reciprocal of the second. |  |
| Determine the sign of the product, and then multiply. |
 |
| Rewrite showing common factors. |  |
| Remove common factors. |  |
| Simplify. |  |
Divide: 
Solution
Solution (click to reveal)

Divide: 
Solution
Solution (click to reveal)
The numerators or denominators of some fractions contain fractions themselves. A fraction in which the numerator or the denominator is a fraction is called a complex fraction .
A complex fraction is a fraction in which the numerator or the denominator contains a fraction.
Some examples of complex fractions are:
![\[ \frac{\frac{6}{7}}{3} \qquad\qquad \frac{\frac{3}{4}}{\frac{5}{8}} \qquad\qquad \frac{\frac{x}{2}}{\frac{5}{6}}\]](https://utsa.pressbooks.pub/app/uploads/quicklatex/quicklatex.com-2ba6ec31a234c63af4137389483f9fb0_l3.png "Rendered by QuickLaTeX.com")
To simplify a complex fraction, remember that the fraction bar means division. For example, the complex fraction  means
means  .
.
Try it!
Simplify: 
Solution (click to reveal)
| Steps | Algebraic |
| Example |  |
| Rewrite as division. |  |
| Multiply the first fraction by the reciprocal of the second. |  |
| Multiply. |  |
| Look for common factors. |  |
| Divide common factors and simplify. |  |

Solution (click to reveal)

Add and Subtract Fractions
When we multiplied fractions, we just multiplied the numerators and multiplied the denominators right straight across. To add or subtract fractions, they must have a common denominator.
Fraction Addition and Subtraction
If a, b, and c are numbers where c ≠ 0, then
![\[\frac{a}{c} + \frac{b}{c} = \frac{a+b}{c} \quad\text{ and }\quad \frac{a}{c} - \frac{b}{c} = \frac{a-b}{c}\]](https://utsa.pressbooks.pub/app/uploads/quicklatex/quicklatex.com-58ac46113290ce23382a2cb8f7b7d911_l3.png "Rendered by QuickLaTeX.com")
To add or subtract fractions, add or subtract the numerators and place the result over the common denominator.
The least common denominator (LCD) of two fractions is the smallest number that can be used as a common denominator of the fractions. The LCD of the two fractions is the least common multiple (LCM) of their denominators.
The least common denominator (LCD) of two fractions is the least common multiple (LCM) of their denominators.
After we find the least common denominator of two fractions, we convert the fractions to equivalent fractions with the LCD. Putting these steps together allows us to add and subtract fractions because their denominators will be the same!
Try it!
Add: 
Solution (click to reveal)
| Steps | Algebraic |
|---|---|
| Step 1. Do they have a common denominator? | No—rewrite each fraction with the LCD (least common denominator). |
| Find the LCD of 12, 18 |
|
| Original problem |  |
| We multiply the numerator and denominator of each fraction by the factor needed to get the denominator to be 36. Do not simplify the equivalent fractions! If you do, you’ll get back to the original fractions and lose the common denominator! |  |
| Step 2. Add or subtract the fractions. |  |
| Add. |  |
| Step 3. Simplify, if possible. | Since 31 is prime, its only factors are 1 and 31. Since 31 does not go into 36, the answer is simplified. |


Solution (click to reveal)


Solution C (click to reveal)

How to add or subtract fractions.
- Do they have a common denominator?
- Yes—go to step 2.
- No—rewrite each fraction with the LCD (least common denominator).
- Find the LCD.
- Change each fraction into an equivalent fraction with the LCD as its denominator.
- Add or subtract the fractions.
- Simplify, if possible.
We now have all four operations for fractions. The table summarizes fraction operations.
| Fraction Multiplication | Fraction Division |
|---|---|
 |
 |
| Multiply the numerators and multiply the denominators | Multiply the first fraction by the reciprocal of the second. |
| Fraction Addition | Fraction Subtraction |
 |
 |
| Add the numerators and place the sum over the common denominator. | Subtract the numerators and place the difference over the common denominator. |
| To multiply or divide fractions, an LCD is NOT needed. To add or subtract fractions, an LCD is needed. |
|
When starting an exercise, always identify the operation and then recall the methods needed for that operation.
Try it!
Simplify: a.  b.
b. 
First ask, “What is the operation?” Identifying the operation will determine whether or not we need a common denominator. Remember, we need a common denominator to add or subtract, but not to multiply or divide.
Solution A (click to reveal)
a.
| Steps | Algebraic |
| What is the operation? | The operation is subtraction. |
| Do the fractions have a common denominator? No. |  – –  |
| Find the LCD of 6 and 10 |
|
| Rewrite each fraction as an equivalent fraction with the LCD. |
|
| Subtract the numerators and place the difference over the common denominators. |  |
| Simplify, if possible. | There are no common factors. The fraction is simplified. |


Solution B (click to reveal)
b.
| Steps | Algebraic |
| What is the operation? Multiplication |  |
| To multiply fractions, multiply the numerators and multiply the denominators. |  |
| Rewrite, showing common factors & Remove common factors. |  |
| Simplify |  |
Notice, we needed an LCD to add in the first exercise, but not to multiply in the second.
Simplify: a.  b.
b. 
Solution (click to reveal)
a. 
b. 
Simplify: a.  b.
b. 
Solution (click to reveal)
a. 
b. 
Decimal Basics
To add or subtract decimals, we line up the decimal points. By lining up the decimal points this way, we can add or subtract the corresponding place values. We then add or subtract the numbers as if they were whole numbers and then place the decimal point in the sum.
How to add or subtract decimals.
- Determine the sign of the sum or difference.
- Write the numbers so the decimal points line up vertically.
- Use zeros as placeholders, as needed.
- Add or subtract the numbers as if they were whole numbers. Then place the decimal point in the answer under the decimal points in the given numbers.
- Write the sum or difference with the appropriate sign.
Try it!
Add or subtract: a.  b.
b. 
Solution A (click to reveal)
a.
| Steps |
Algebraic |
| The difference will be negative. To subtract, we add the numerals. Write the numbers so the decimal points line up vertically. |
23.5 + 41.38 |
Put 0 as a placeholder after the 5 in 23.5. Remember,  , so , so  . . |
23.50 + 41.38 |
| Add the numbers as if they were whole numbers. Then place the decimal point in the sum. |  |
| Write the result with the correct sign. |  |
Solution B (click to reveal)
b. 
| Steps |
Algebraic |
| The difference will be negative. To subtract, we subtract 14.65 from 20. Write the numbers so the decimal points line up vertically. |
20 – 14.65 |
| Remember, 20 is a whole number, so place the decimal point after the 0. Put in zeros to the right as placeholders. |
20.00 – 14.65 |
| Subtract and place the decimal point in the answer. |
|
| Write the result with the correct sign. |  |
![\[ \begin{array}{cccccc} & \boldsymbol{9} & \boldsymbol{9} &&&\\ \boldsymbol{1} & \cancel{\boldsymbol{10}} & \cancel{\boldsymbol{10}} & \boldsymbol{10} & &\\ \boldsymbol{2} & \boldsymbol{0.} & \boldsymbol{0} & \boldsymbol{0} && \\ \boldsymbol{-1} & \boldsymbol{4.} & \boldsymbol{6} & \boldsymbol{5} &&\\ \hline & \boldsymbol{5.} & \boldsymbol{3} & \boldsymbol{5} && \\ \end{array} \]](https://utsa.pressbooks.pub/app/uploads/quicklatex/quicklatex.com-37fd2a6a6fa707ee0ab13ee960b04111_l3.png "Rendered by QuickLaTeX.com")
When we multiply signed decimals, first we determine the sign of the product and then multiply as if the numbers were both positive. We multiply the numbers temporarily ignoring the decimal point and then count the number of decimal points in the factors and that sum tells us the number of decimal places in the product. Finally, we write the product with the appropriate sign.
How to multiply decimals.
- Determine the sign of the product.
- Write in vertical format, lining up the numbers on the right. Multiply the numbers as if they were whole numbers, temporarily ignoring the decimal points.
- Place the decimal point. The number of decimal places in the product is the sum of the number of decimal places in the factors.
- Write the product with the appropriate sign.
Try it!
Multiply: 
Solution (click to reveal)
| Steps | Algebraic |
| Example |  |
| The signs are different. The product will be negative. | The product will be negative. |
| Write in vertical format, lining up the numbers on the right. |
|
| Multiply. |
|
| Add the number of decimal places in the factors (1 + 3). |
 |
| Place the decimal point 4 places from the right. |
|
| The signs are different, so the product is negative. |  |

![\[ \begin{array}{ccccccc} && \boldsymbol{4.} & \boldsymbol{0} & \boldsymbol{7} & \boldsymbol{5} & \\ & & \boldsymbol{\times} & & \boldsymbol{3.} & \boldsymbol{9} & \\ \hline & \boldsymbol{3} & \boldsymbol{6} & \boldsymbol{6} & \boldsymbol{7} & \boldsymbol{5} & \\ \boldsymbol{1} & \boldsymbol{2} & \boldsymbol{2} & \boldsymbol{2} & \boldsymbol{5} & & \\ \hline \boldsymbol{1} & \boldsymbol{5} & \boldsymbol{8} & \boldsymbol{9} & \boldsymbol{2} & \boldsymbol{5} & \\ \end{array} \]](https://utsa.pressbooks.pub/app/uploads/quicklatex/quicklatex.com-509046d44c1ee12d9ae66c6605b75862_l3.png "Rendered by QuickLaTeX.com")
![\[ \begin{array}{ccccccc} && \boldsymbol{4.} & \boldsymbol{0} & \boldsymbol{7} & \boldsymbol{5} & \\ & & \boldsymbol{\times} & & \boldsymbol{3.} & \boldsymbol{9} & \\ \hline & \boldsymbol{3} & \boldsymbol{6} & \boldsymbol{6} & \boldsymbol{7} & \boldsymbol{5} & \\ \boldsymbol{1} & \boldsymbol{2} & \boldsymbol{2} & \boldsymbol{2} & \boldsymbol{5} & & \\ \hline \boldsymbol{1} & \boldsymbol{5.} & \boldsymbol{8} & \boldsymbol{9} & \boldsymbol{2} & \boldsymbol{5} & \\ & \multicolumn{4}{r}{\underbrace{\hspace{4.5em}}_{\textcolor{myblue1}{\text{4 places}}}} & & \end{array} \]](https://utsa.pressbooks.pub/app/uploads/quicklatex/quicklatex.com-3204aaa8cfc45d7499cbdbf20742f659_l3.png "Rendered by QuickLaTeX.com")
Often, especially in the sciences, you will multiply decimals by powers of 10 (10, 100, 1000, etc). If you multiply a few products on paper, you may notice a pattern relating the number of zeros in the power of 10 to number of decimal places we move the decimal point to the right to get the product.
How to multiply a decimal by a power of ten.
- Move the decimal point to the right the same number of places as the number of zeros in the power of 10.
- Add zeros at the end of the number as needed.
Try it!
Multiply: 5.63 by a. 10 b. 100 c. 1000.
Solution A (click to reveal)
By looking at the number of zeros in the multiple of ten, we see the number of places we need to move the decimal to the right.
a.
| Steps | Algebraic |
| Example | 5.63 (10) |
| There is 1 zero in 10, so move the decimal point 1 place to the right. |  |
| Solution | 56.3 |
Solution B (click to reveal)
b.
| Steps | Algebraic |
| Example | 5.63 (100) |
| There are 2 zeroes in 100, so move the decimal point 2 places to the right. |  |
| Solution | 563 |
Solution C (click to reveal)
c.
| Steps | Algebraic |
| Example | 5.63 (1000) |
| There are 3 zeroes in 1,000, so move the decimal point 3 place to the right. |  |
| A zero must be added to the end. | 5630 |
Just as with multiplication, division of signed decimals is very much like dividing whole numbers. We just have to figure out where the decimal point must be placed and the sign of the quotient. When dividing signed decimals, first determine the sign of the quotient and then divide as if the numbers were both positive. Finally, write the quotient with the appropriate sign.
We review the notation and vocabulary for division:
![\[ \begin{array}{ccccc} \boldsymbol{a} & \div & \boldsymbol{b} & = & \boldsymbol{c} \\ \text{\boldsymbol{dividend}} & & \text{\boldsymbol{divisor}} & & \text{\boldsymbol{quotient}} \end{array} \]](https://utsa.pressbooks.pub/app/uploads/quicklatex/quicklatex.com-f1ce8f7e7f6ed0907d3d9b44f2dc664d_l3.png "Rendered by QuickLaTeX.com")

We’ll write the steps to take when dividing decimals for easy reference.
How to divide decimals.
- Determine the sign of the quotient.
- Make the divisor a whole number by “moving” the decimal point all the way to the right. “Move” the decimal point in the dividend the same number of places—adding zeros as needed.
- Divide. Place the decimal point in the quotient above the decimal point in the dividend.
- Write the quotient with the appropriate sign.
Try it!
Divide:  .
.
Solution (click to reveal)
Remember, you can “move” the decimals in the divisor and dividend because of the Equivalent Fractions Property.
| Steps | Algebraic |
| Determine the sign of the quotient | The signs are the same so, the quotient is positive. |
| Make the divisor a whole number by “moving” the decimal point all the way to the right. And “Move” the decimal point in the dividend the same number of places. |
|
| Divide.
Place the decimal point in the quotient above the |
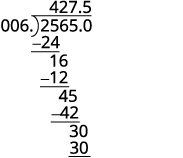 |
| Write the quotient with the appropriate sign. |  |
Percent Basics
How many cents are in one dollar? There are 100 cents in a dollar. How many years are in a century? There are 100 years in a century. Does this give you a clue about what the word “percent” means? It is really two words, “per cent,” and means per one hundred. A percent is a ratio whose denominator is 100. We use the percent symbol %, to show percent.
A percent is a ratio whose denominator is 100.
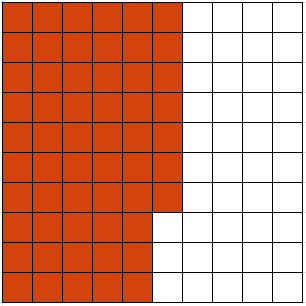
According to data from the American Association of Community Colleges (2015), about 57% of community college students are female. This means 57 out of every 100 community college students are female, as the image below shows. Out of the 100 squares on the grid, 57 are shaded, which we write as the ratio  .
.
Similarly, 25% means a ratio of  , 3% means a ratio of
  , and 100% means a ratio of
  . In words, “one hundred percent” means the total 100% is , and since
  , we see that 100% means 1 whole.
Try it!
According to the Public Policy Institute of California (2010), 44% of parents of public school children would like their youngest child to earn a graduate degree. Write this percent as a ratio.
Solution (click to reveal)
| Steps | Algebraic |
| The amount we want to convert is 44%. | 44% |
| Write the percent as a ratio. Remember that percent means per 100. |  |
In 2007, according to a U.S. Department of Education report, 21 out of every 100 first-time freshmen college students at 4-year public institutions took at least one remedial course. Write this as a ratio and then as a percent.
Solution (click to reveal)
| Steps | Algebraic |
| The amount we want to convert is 21 out of 100. | 21 out of 100 |
| Write as a ratio. |  |
| Convert the 21 per 100 to percent. | 21% |
Since percents are ratios, they can easily be expressed as fractions. Remember that percent means per 100, so the denominator of the fraction is 100.
How to convert a percent to a fraction.
- Write the percent as a ratio with the denominator 100.
- Simplify the fraction if possible.
Try it!
Convert each percent to a fraction: a. 36% b. 125%
Solution A (click to reveal)
a.
| Steps | Algebraic |
| Percentage | 36% |
| Write as a ratio with denominator 100. |  |
| Simplify. |  |
Solution B (click to reveal)
b.
| Steps | Algebraic |
| Percentage | 125% |
| Write as a ratio with denominator 100. |  |
| Simplify. |  or 1 or 1 |
The previous example shows that a percent can be greater than 1. We saw that 125% means  , or
, or  . These are improper fractions, and their values are greater than one.
Try it!
Convert each percent to a fraction: a. 24.5% b.  %
%
Solution A (click to reveal)
| Steps | Algebraic |
| Percentage | 24.5% |
| Write as a ratio with denominator 100. |  |
| Clear the decimal by multiplying numerator and denominator by 10. |  |
| Multiply. |  |
| Rewrite showing common factors. |  |
| Simplify. |  |
Solution B (click to reveal)
b.
| Steps | Algebraic |
| Percentage |  % % |
| Write as a ratio with denominator 100. |  |
| Write the numerator as an improper fraction. |  |
Rewrite as fraction division, replacing 100 with  |
 |
| Multiply by the reciprocal. |  |
| Simplify. |  |
In decimals, we learned how to convert fractions to decimals. To convert a percent to a decimal, we first convert it to a fraction and then change the fraction to a decimal.
How to convert a percent to a decimal.
- Write the percent as a ratio with the denominator 100.
- Convert the fraction to a decimal by dividing the numerator by the denominator.
Try it!
Convert each percent to a decimal: a. 6% b. 78%
Because we want to change to a decimal, we will leave the fractions with denominator 100 instead of removing common factors.
Solution A (click to reveal)
a.
| Steps | Algebraic |
| Percentage | 6% |
| Write as a ratio with denominator 100. |  |
| Change the fraction to a decimal by dividing the numerator by the denominator. | 0.06 |
Solution B (click to reveal)
b.
| Steps | Algebraic |
| Percentage | 78% |
| Write as a ratio with denominator 100. |  |
| Change the fraction to a decimal by dividing the numerator by the denominator. | 0.78 |
Convert each percent to a decimal: a. 135% b. 12.5%
Solution A (click to reveal)
a.
| Steps | Algebraic |
| Percentage | 135% |
| Write as a ratio with denominator 100. |  |
| Change the fraction to a decimal by dividing the numerator by the denominator. | 1.35 |
Solution B (click to reveal)
b.
| Steps | Algebraic |
| Percentage | 12.5% |
| Write as a ratio with denominator 100. |  |
| Change the fraction to a decimal by dividing the numerator by the denominator. | 0.125 |
Let’s summarize the results from the previous examples in the table below, and look for a pattern we could use to quickly convert a percent number to a decimal number.
| Percent | Decimal |
|---|---|
| 6% | 0.06 |
| 78% | 0.78 |
| 135% | 1.35 |
| 12.5% | 0.125 |
Do you see the pattern?
To convert a percent number to a decimal number, we move the decimal point two places to the left and remove the % sign. (Sometimes the decimal point does not appear in the percent number, but just like we can think of the integer 6 as 6.0, we can think of 6% as 6.0%.) Notice that we may need to add zeros in front of the number when moving the decimal to the left.
The table below uses the percents from the table above and shows visually how to convert them to decimals by moving the decimal point two places to the left.
| Percent | Decimal |
|---|---|
|
|
0.06 |
|
|
0.78 |
|
|
1.35 |
|
|
0.125 |
![\[ \boldsymbol{0} \underline{\smash{\boldsymbol{06.}}}\boldsymbol{\%} \]](https://utsa.pressbooks.pub/app/uploads/quicklatex/quicklatex.com-cc853d2927c5f327d6185906ba36fce5_l3.png "Rendered by QuickLaTeX.com")
![\[\boldsymbol{0}\underline{\smash{\boldsymbol{78.}}}\boldsymbol{\%}\]](https://utsa.pressbooks.pub/app/uploads/quicklatex/quicklatex.com-17d6c89ea24e80bf72c86452d445ccc5_l3.png "Rendered by QuickLaTeX.com")
![\[ \boldsymbol{1} \underline{\smash{\boldsymbol{35.}}}\boldsymbol{\%}\]](https://utsa.pressbooks.pub/app/uploads/quicklatex/quicklatex.com-cae9b2187615b14efc1cf87011fea53c_l3.png "Rendered by QuickLaTeX.com")
![\[ \boldsymbol{0} \underline{\smash{\boldsymbol{12.}}}\boldsymbol{5\%} \]](https://utsa.pressbooks.pub/app/uploads/quicklatex/quicklatex.com-f3991f3d0496929f1a4743dfc8db10e6_l3.png "Rendered by QuickLaTeX.com")
Try it!
Among a group of business leaders, 77% believe that poor math and science education in the U.S. will lead to higher unemployment rates.
Convert the percent to: a. a fraction b. a decimal
Solution A (click to reveal)
a.
| Steps | Algebraic |
| Percentage | 77% |
| Write as a ratio with denominator 100. |  |
Solution B (click to reveal)
b.
| Steps | Algebraic |
| Percentage | |
| Change the fraction to a decimal by dividing the numerator by the denominator. | 0.77 |
There are four suits of cards in a deck of cards—hearts, diamonds, clubs, and spades. The probability of randomly choosing a heart from a shuffled deck of cards is 25%.
Convert the percent to: a. a fraction b. a decimal
Solution A (click to reveal)
a.
| Steps | Algebraic |
| Percentage | 25% |
| Write as a ratio with denominator 100. |  |
| Simplify. | |
Solution B (click to reveal)
b.
| Steps | Algebraic |
| Percentage | |
| Change the fraction to a decimal by dividing the numerator by the denominator. | 0.25 |
Key Concepts
- Equivalent Fractions Property
If a, b, and c are numbers where b ≠ 0, c ≠ 0, then and
and
- How to simplify a fraction.
- Rewrite the numerator and denominator to show the common factors. If needed, factor the numerator and denominator into prime numbers first.
- Simplify using the Equivalent Fractions Property by dividing out common factors.
- Multiply any remaining factors.
- Fraction Multiplication
If a, b, c, and d are numbers where b ≠ 0, and d ≠ 0, then:

To multiply fractions, multiply the numerators and multiply the denominators.
- Fraction Division
If a, b, c, and d are numbers where b ≠ 0, c ≠ 0, and d ≠ 0, then

To divide fractions, we multiply the first fraction by the reciprocal of the second.
- Fraction Addition and Subtraction
If a, b, and c are numbers where c ≠ 0, then
and To add or subtract fractions, add or subtract the numerators and place the result over the common denominator.
- Placement of Negative Sign in a Fraction
For any positive numbers a and b,
- How to simplify complex fractions.
- Simplify the numerator.
- Simplify the denominator.
- Divide the numerator by the denominator. Simplify if possible.
- Derived from Openstax Intermediate Algebra; Access for free at https://openstax.org/books/intermediate-algebra-2e/pages/1-introduction. Pre-algebra; Access for free at https://openstax.org/books/prealgebra-2e/pages/1-introduction ↵
Topics Covered:[1]
Defining Slope
When you graph linear equations, you may notice that some lines tilt up as they go from left to right and some lines tilt down. Some lines are very steep and some lines are flatter.
In mathematics, the measure of the steepness of a line is called the slope of the line.
The concept of slope has many applications in the real world. In construction the pitch of a roof, the slant of the plumbing pipes, and the steepness of the stairs are all applications of slope. and as you ski or jog down a hill, you definitely experience slope.
We can assign a numerical value to the slope of a line by finding the ratio of the rise and run. The rise is the amount the vertical distance changes while the run measures the horizontal change, as shown in this illustration. Slope is a rate of change.
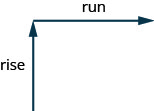
Slope of a Line
The slope of a line is m = [latex]\displaystyle\frac{\text{rise}}{\text{run}}[/latex] .
The rise measures the vertical change and the run measures the horizontal change.
- Locate two points on the line whose coordinates are integers.
- Starting with one point, sketch a right triangle, going from the first point to the second point.
- Count the rise and the run on the legs of the triangle.
- Take the ratio of rise to run to find the slope: m = [latex]\displaystyle\frac{\text{rise}}{\text{run}}[/latex] .
To find the slope of a line, we locate two points on the line whose coordinates are integers. Then we sketch a right triangle where the two points are vertices and one side is horizontal and one side is vertical.
Try It!
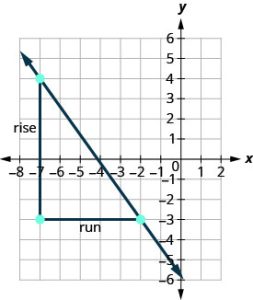
Find the slope of the line shown.
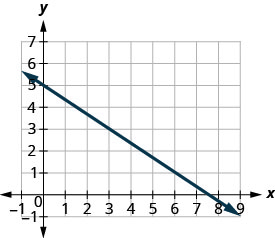
Solution (click to reveal)
| Steps | Algebraic |
| Locate two points on the graph whose coordinates are integers. |
(0,5) and (3,3) |
| Starting at (0,5), sketch a right triangle to (3,3) as shown in this graph. | 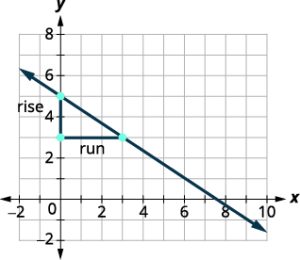 |
| Count the rise— since it goes down, it is negative. | The rise is −2. |
| Count the run. | The run is 3. |
| Use the slope formula. | m = [latex]\displaystyle\frac{\text{rise}}{\text{run}}[/latex] . |
| Substitute the values of the rise and run. | m = [latex]\dispalystyle\frac{-2}{3}[/latex] |
| Simplify. | m = - [latex]\dispalystyle\frac{2}{3}[/latex] |
| Solution: | The slope of the line is - [latex]\dispalystyle\frac{2}{3}[/latex]. So y decreases by 2 units as x increases by 3 units. |
How do we find the slope of horizontal and vertical lines? To find the slope of the horizontal line, y = 4, we could graph the line, find two points on it, and count the rise and the run. Let’s see what happens when we do this, as shown in the graph below.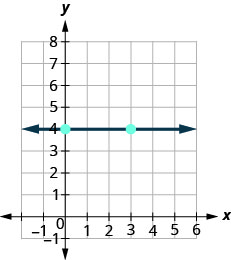 What is the rise? The rise is 0.
What is the run? The run is 3.
What is the slope? [latex]\displaystyle m = \frac{\text{rise}}{\text{run}} = \frac{0}{3}[/latex] , m = 0
The slope of the horizontal line y = 4 is 0.
Let’s also consider a vertical line, the line x = 3, as shown in the graph.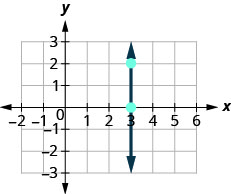 What is the rise? The rise is 2.
What is the run? The run is 0.
What is the slope? [latex]\displaystyle m = \frac{\text{rise}}{\text{run}} = \frac{2}{0}[/latex],
The slope is undefined since division by zero is undefined. So we say that the slope of the vertical line x = 3 is undefined.
All horizontal lines have slope 0. When the y-coordinates are the same, the rise is 0.
The slope of any vertical line is undefined. When the x-coordinates of a line are all the same, the run is 0.
The slope of a horizontal line, y = b, is 0.
The slope of a vertical line, x = a, is undefined.
Try it!
Find the slope of each line: a. x = 8 b. y = −5.
Solution (click to reveal)
a. x = 8 This is a vertical line. Its slope is undefined.
b. y = −5 This is a horizontal line. It has slope 0.
Quick Guide to the Slopes of Lines
[latex]\Huge\boldsymbol{\underset{positive}{\nearrow}\qquad\underset{negative}{\searrow}\qquad\underset{zero}{\longleftrightarrow}\qquad\underset{positive}{\updownarrow}}[/latex]
We will use (x1, y1) to identify the first point and (x2, y2) to identify the second point.
Let’s see how the rise and run relate to the coordinates of the two points by taking another look at the slope of the line between the points (2, 3) and (7, 6), as shown in this graph.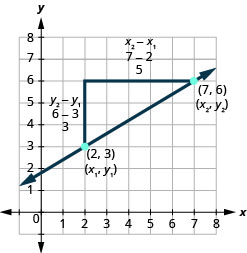
| Steps | Algebraic |
| Since we have two points, we will use subscript notation. | [latex]\begin{pmatrix} x_1 & y_1 \\ 2, & 3 \end{pmatrix}\begin{pmatrix} x_2 & y_2 \\ 7, & 6 \end{pmatrix}[/latex]
|
| On the graph, we counted the rise of 3 and the run of 5
Notice that the rise of 3 can be found by subtracting the y-coordinates, 6 and 3, and the run of 5 can be found by subtracting the x-coordinates 7 and 2. |
m = [latex]\displaystyle\frac{\text{rise}}{\text{run}}[/latex]; so m = [latex]\displaystyle\frac{3}{5}[/latex] |
| We rewrite the rise and run by putting in the coordinates. | m = [latex]\displaystyle\frac{6 - 3}{7 - 2}[/latex] |
| But 6 is y2, the y-coordinate of the second point and 3 is y1, the y-coordinate of the first point. So we can rewrite the slope using subscript notation. | m = [latex]\displaystyle\frac{y_2 - y_1}{7 - 2}[/latex] |
| Also 7 is the x-coordinate of the second point and 2 is the x-coordinate of the first point. So again we rewrite the slope using subscript notation. | m = [latex]\displaystyle\frac{y_2 - y_1}{x_2 - x_1}[/latex] |
Slope also indicates the direction in which a line slants as well as its steepness. Slope is sometimes described as rise over run.
Try it!
Use the slope formula to find the slope of the line through the points (−2, −3) and (−7, 4).
Solution (click to reveal)
| Steps | Algebraic |
| We’ll call (−2, −3) point #1 and (−7, 4) point #2. | [latex]\begin{pmatrix} x_1 & y_1 \\ -2, & -3 \end{pmatrix}\begin{pmatrix} x_2 & y_2 \\ -7, & 4 \end{pmatrix}[/latex] |
| Use the slope formula. | m = [latex]\displaystyle\frac{y_2 - y_1}{x_2 - x_1}[/latex] |
| Substitute the values. y of the second point minus y of the first point, x of the second point minus x of the first point |
m = [latex]\displaystyle\frac{4 - (-3)}{-7 - (-2)}[/latex] |
| Simplify. | m = [latex]\displaystyle\frac{7}{-5}[/latex] |
| Solution | m = - [latex]\displaystyle\frac{7}{5}[/latex] |
Let’s verify this slope on the graph shown.
[latex] \begin{align*} \displaystyle m &= \frac{\text{rise}}{\text{run}} \\ m &= \frac{7}{-5} \\ m &= - \frac{7}{5} \end{align*}[/latex]
Try it! - Finding the Slope of a Line Given Two Points
Find the slope of a line that passes through the points (2, −1) and (−5, 3).
Solution (click to reveal)
We substitute the y-values and the x-values into the formula.
The slope is [latex]\displaystyle -\frac{4}{7}[/latex]
It does not matter which point is called (x1, y1) or (x2, y2). As long as we are consistent with the order of the y terms and the order of the x terms in the numerator and denominator, the calculation will yield the same result.
Slope and Equations
Now that we've defined slope, and looked at the Standard form of a line (Ax + By = C), there are two other forms of a linear equation in addition to the Standard form:
| Point Slope Form | Slope Intercept Form |
| y − y1 = m(x − x1) | y = mx + b |
| where m = slope, (x1, y1) is a point on the line. | where m = slope and b = y-intercept. |
What if all you are given is 2 points of a line? We know from the previous section that you could use them to determine slope, but this process will also allow us to find out what the linear equation would look like.
Suppose we have a line that has slope m and that contains some specific point (x1, y1) and some other point, which we will just call (x, y). We can write the slope of this line and then change it to a different form.
| Steps | Algebraic |
| Formula | m = [latex]\displaystyle\frac{y - y_1}{x - x_1}[/latex] |
| Multiply both sides of the equation by x − x1. | m(x - x1) = [latex]\displaystyle (\frac{y - y_1}{x - x_1})(x - x_1)[/latex] |
| Simplify. | m(x - x1) = y - y1 |
| Rewrite the equation with the y terms on the left. | y - y1 = m(x - x1) |
How to Solve for the Equation of a Line with Point-slope Formula
- Find the slope using the given points. m = [latex]\displaystyle\frac{y_2 - y_1}{x_2 - x_1}[/latex]
- Choose one point.
- Substitute the values into the point-slope form: y − y1 = m (x − x1)
- Write the equation in slope-intercept form.
Once we have the slope, we can use it and one of the given points to find the equation using the point-slope formula. The following example gives two points, so you need to solve for slope first and then use one of the points.
Try it!
Find the equation of the line passing through the points (3, 4) and (0, −3). Write the final equation in slope-intercept form.
Solution (click to reveal)
First, we calculate the slope using the slope formula and two points.
Next, we use the point-slope formula with the slope of [latex]\displaystyle\frac{7}{3}[/latex], and either point. Let’s pick the point (3, 4) for (x1, y1).
The equation is written as y = [latex]\displaystyle\frac{7}{3}x[/latex] - 3. (this is known as Slope-intercept form).
Analysis
To prove that either point can be used, let us use the second point (0,−3) and see if we get the same equation.
We see that the same line will be obtained using either point. This makes sense because we used both points to calculate the slope.
Find an equation of a line that contains the points (−3, 5) and (−3, 4). Write the equation in slope-intercept form.
Solution (click to reveal)
Again, the first step will be to find the slope.
| Question | Algebraic |
| Formula | m = [latex]\displaystyle\frac{y_2 - y_1}{x_2 - x_1}[/latex] |
| Multiply both sides of the equation by x − x1. | m = [latex]\displaystyle\frac{4 - 5}{-3 - (-3)}[/latex] |
| Simplify. | m = [latex]\displaystyle\frac{-1}{0}[/latex] |
| Rewrite the equation with the y terms on the left. | The Slope is undefined. |
This tells us it is a vertical line. Both of our points have an x-coordinate of −3. So our equation of the line is x = −3. Since there is no y, we cannot write it in slope-intercept form.
You may want to sketch a graph using the two given points. Does your graph agree with our conclusion that this is a vertical line?
Try it! - How to Find the Equation of a Line Given Two Points
Find an equation of a line that contains the points (−3,−1) and (2,−2) Write the equation in slope-intercept form.
Solution (click to reveal)
| Steps | Algebraic |
| Find the slope using the given points, (-3, -1) and (2, -2). | [latex] \begin{align*} m &= \frac{y_2 - y_1}{x_2 - x_1} \\ m &= \frac{-2 - (-1)}{2 - (-3)} \\ m &= \frac{-1}{5} \\ \textcolor{mypurple1}{m} &\textcolor{mypurple1}{= -\frac{1}{5}} \end{align*} [/latex] |
| Choose either one point. | [latex] \begin{pmatrix} \textcolor{myred1}{x_1} & \textcolor{myred1}{y_1} \\ \textcolor{myred1}{2,} & \textcolor{myred1}{-2} \end{pmatrix} [/latex] |
| Substitute the values into the point-slope form, y - y1 = m(x - x1). | [latex] \begin{align*} y - \textcolor{myred1}{y_1} &= \textcolor{mypurple1}{m}(x - \textcolor{myred1}{x_1}) \\ y - \textcolor{myred1}{(-2)} &= -\textcolor{mypurple1}{\frac{1}{5}}(x - \textcolor{myred1}{2}) \\ y + 2 &= -\frac{1}{5}x + \frac{2}{5} \end{align*} [/latex] |
| Write the equation in slope-intercept form. | [latex]\displaystyle y = -\frac{1}{5}x - \frac{8}{5} [/latex] |
In the examples above you will note the form of the equation we get after using point-slope form is: y = mx + b. where m = slope and b = y-intercept. Practice identifying them below.
Try it! - Identifying the Slope and y-intercept of a Line Given an Equation
Identify the slope and y-intercept, given the equation y = -[latex]\displaystyle\frac{3}{4}x[/latex] - 4
Solution (click to reveal)
As the line is in y = mx + b form, the given line has a slope of m = -[latex]\displaystyle\frac{3}{4}[/latex]. The y-intercept is b = −4.
Analysis:
The y-intercept is the point at which the line crosses the y-axis. On the y-axis, x = 0. We can always identify the y-intercept when the line is in slope-intercept form, as it will always equal b. Or, just substitute x=0 and solve for y.
We can easily determine the slope and intercept of a line if the equation is written in slope-intercept form, y = mx+b. Now we will do the reverse—we will start with the slope and y-intercept and use them to find the equation of the line.
- Identify the slope.
- Identify the point.
- Substitute the values into the point-slope form, y − y1 = m(x − x1).
- Write the equation in slope-intercept form.
Try it! - Finding the Equation of a Line Given the Slope and One Point
Write the equation of the line with slope m = −3 and passing through the point (4, 8). Then solve the equation for y.
Solution (click to reveal)
Using the point-slope formula, substitute −3 for m and the point (4, 8) for (x1, y1).
Analysis
Note that any point on the line can be used to find the equation. If done correctly, the same final equation will be obtained.
Find the equation of a line with slope m = -[latex]\displaystyle\frac{2}{5}x[/latex] and containing the point (10, −5).
Solution (click to reveal)
y = -[latex]\displaystyle\frac{2}{5}x[/latex] - 1
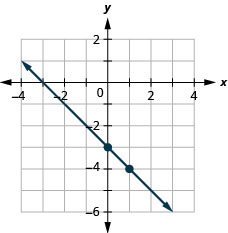
Find the equation of the line shown in the graph.
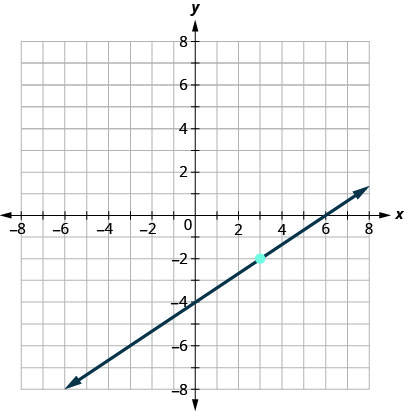
Solution (click to reveal)
We need to find the slope and y-intercept of the line from the graph so we can substitute the needed values into the slope-intercept form, y = mx + b
To find the slope, we choose two points on the graph.
The y-intercept is (0, −4) and the graph passes through (3, −2).
| Steps | Algebraic |
| Slope formula | [latex] \displaystyle m = \frac{\text{rise}}{\text{run}}[/latex] |
| Find the slope, by counting the rise and run. | [latex] \displaystyle m = \textcolor{myred1}{\frac{2}{3}}[/latex] |
| Find the y-intercept. | [latex] \displaystyle \text{y-intercept} (0, \textcolor{mypurple1}{-4})[/latex] |
| Substitute the values into y = mx + b | [latex]\displaystyle y = \textcolor{myred1}{m}x + \textcolor{mypurple1}{b}[/latex] |
| Solution | [latex]\displaystyle y = \textcolor{myred1}{\frac{2}{3}}x - \textcolor{mypurple1}{4}[/latex] |
Find an equation of a horizontal line that contains the point (−2, −6). Write the equation in slope-intercept form.
Solution (click to reveal)
Every horizontal line has slope 0. We can substitute the slope and points into the point-slope form, y − y1 = m(x − x1).
| Steps | Algebraic |
| Identify the slope. | [latex]\displaystyle m = \textcolor{mypurple1}{0}[/latex] |
| Identify the point. | [latex] \displaystyle \begin{pmatrix} \textcolor{myred1}{x_1} & \textcolor{myred1}{y_1} \\ \textcolor{myred1}{-2,} & \textcolor{myred1}{-6} \end{pmatrix}[/latex] |
| Substitute the values into y − y1 = m(x − x1) | [latex] \begin{align*} \displaystyle y - \textcolor{myred1}{y_1} &= \textcolor{mypurple1}{m}(x - \textcolor{myred1}{x_1}) \\ y - \textcolor{myred1}{(-6)} &= \textcolor{mypurple1}{m}(x - \textcolor{myred1}{(-2)}) \end{align*} [/latex] |
| Simplify. | [latex] \begin{align*} \displaystyle y + 6 &= 0 \\ y &= -6 \end{align*} [/latex] |
| Write in slope-intercept form. | It is in y-form, but could be written y = 0x − 6. |
Did we end up with the form of a horizontal line, y = a?
Graphing and Slope
We can also graph a line when we know one point and the slope of the line. We will start by plotting the point and then use the definition of slope to draw the graph of the line.
Try it! - How to graph a Line Given a Point and the Slope
Graph the line passing through the point (1, −1) whose slope is m = [latex]\displaystyle\frac{3}{4}[/latex].
Solution (click to reveal)
| Steps | Algebraic |
| Plot the given point (1, -1). | 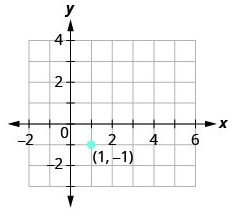 |
| Use the slope formula [latex]\displaystyle m = \frac{\text{rise}}{\text{run}}[/latex] to identify the rise and the run. | [latex] \begin{align*} \displaystyle m &= \frac{3}{4} \\ \frac{rise}{run} &= \frac{3}{4} \\ rise &= 3 \\ run &= 4 \end{align*} [/latex] |
| Starting at the given point (1, -1), count out the rise (up 3 units) and run (right 4 units) to mark the second point. | 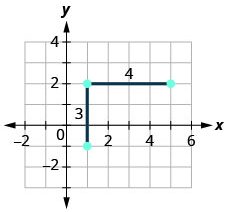 |
| Connect the two points with a line. | 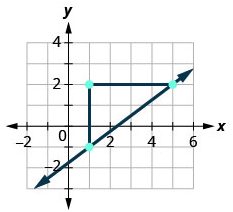 |
You can check your work by finding a third point. Since the slope is m = [latex]\displaystyle\frac{3}{4}[/latex] it can also be written as m = [latex]\displaystyle\frac{-3}{-4}[/latex] (negative divided by negative is positive!). Go back to (1, −1) and count out the rise, −3, and the run, −4.
Graph the line passing through the point (2, −2) with the slope m = [latex]\displaystyle\frac{4}{3}[/latex]
Solution (click to reveal)
Graph the line passing through the point (−2, 3) with the slope m = [latex]\displaystyle\frac{1}{4}[/latex]
Solution (click to reveal)
- Plot the given point.
- Use the slope formula m = [latex]\displaystyle\frac{\text{rise}}{\text{run}}[/latex] to identify the rise and the run.
- Starting at the given point, count out the rise and run to mark the second point.
- Connect the points with a line.
Graphing with Slope and Intercept
We have graphed linear equations by plotting points, using intercepts, recognizing horizontal and vertical lines, and using one point and the slope of the line. Once we see how an equation in slope–intercept form and its graph are related, we’ll have one more method we can use to graph lines.
Let’s look at the graph of the equation y = [latex]\displaystyle\frac{1}{2}x[/latex] + 3 and find its slope and y-intercept.
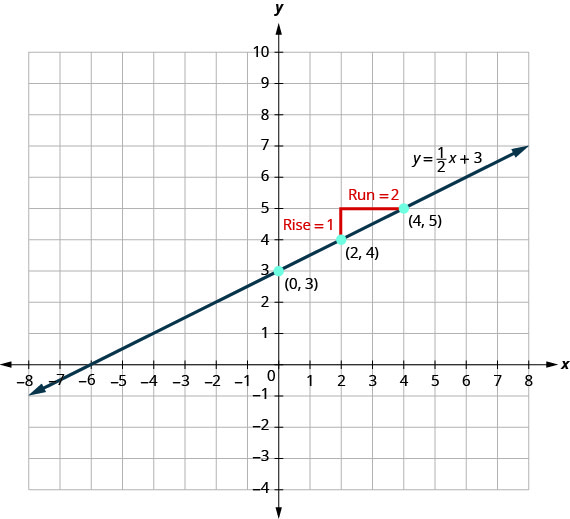
The red lines in the graph show us the rise is 1 and the run is 2. Substituting into the slope formula:
The y-intercept is (0, 3).
Look at the equation of this line.
[latex]\displaystyle y = \textcolor{myred1}{\frac{1}{2}}x + \textcolor{mypurple1}{3}[/latex]
Look at the slope and y-intercept.
slope [latex]\displaystyle m = \textcolor{myred1}{\frac{1}{2}}[/latex] and y-intercept [latex]\dispalystyle (0, \textcolor{mypurple1}{3})[/latex].
When a linear equation is solved for y, the coefficient of the x term is the slope and the constant term is the y-coordinate of the y-intercept. We say that the equation y = [latex]\displaystyle\frac{1}{2}x[/latex] + 3 is in slope–intercept form. Sometimes the slope–intercept form is called the “y-form.”
[latex]\displaystyle m = \textcolor{myred1}{\frac{1}{2}}[/latex]; y-intercept [latex]\dispalystyle (0, \textcolor{mypurple1}{3})[/latex]
[latex]\displaystyle y = \textcolor{myred1}{\frac{1}{2}}x + \textcolor{mypurple1}{3}[/latex]
[latex]\displaystyle y = \textcolor{myred1}{m}x + \textcolor{mypurple1}{b}[/latex]
Let’s practice finding the values of the slope and y-intercept from the equation of a line.
Try It!
Identify the slope and y-intercept of the line from the equation:
a. y = −[latex]\displaystyle\frac{4}{7}x[/latex] − 2 b. x + 3y = 9
Solution A (click to reveal)
a. We compare our equation to the slope–intercept form of the equation.
| Steps | Algebraic |
| Write the slope–intercept form of the equation of the line. | [latex]\displaystyle y = \textcolor{myred1}{m}x + \textcolor{mypurple1}{b}[/latex] |
| Write the equation of the line. | [latex]\displaystyle y = -\textcolor{myred1}{\frac{4}{7}}x \textcolor{mypurple1}{-2}[/latex] |
| Identify the slope. | [latex]\displaystyle y = -\textcolor{myred1}{\frac{4}{7}} [/latex] |
| Identify the y-intercept. | [latex]\dispalystyle \text{y-intercept is } (0, \textcolor{mypurple1}{3})[/latex] |
Solution B (click to reveal)
b. When an equation of a line is not given in slope–intercept form, our first step will be to solve the equation for y.
| Steps | Algebraic |
| Solve for y. | [latex] \displaystyle x + 3y = 9 [/latex] |
| Subtract x from each side. | [latex]\displaystyle 3y = -x + 9 [/latex] |
| Divide both sides by 3. | [latex]\displaystyle \frac{3y}{3} = \frac{-x + 9}{3} [/latex] |
| Simplify. | [latex]\displaystyle -\frac{1}{3}x + 3[/latex] |
| Write the slope–intercept form of the equation of the line. | [latex]\displaystyle y = \textcolor{myred1}{m}x + \textcolor{mypurple1}{b}[/latex] |
| Write the equation of the line. | [latex]\displaystyle y = \textcolor{myred1}{-\frac{1}{3}}x + \textcolor{mypurple1}{3}[/latex] |
| Identify the slope. | [latex]\displaystyle m = \textcolor{myred1}{-\frac{1}{3}}[/latex] |
| Identify the y-intercept. | [latex]\dispalystyle \text{y-intercept is } (0, \textcolor{mypurple1}{3})[/latex] |
Identify the slope and y-intercept from the equation of the line.
a. y = −[latex]\displaystyle\frac{4}{3}x[/latex] + 1
b. 3x + 2y = 12
Solution (click to reveal)
a. m = −[latex]\displaystyle\frac{4}{3}[/latex]; (0, 1)
b. m = −[latex]\displaystyle\frac{3}{2}[/latex]; (0, 6)
We have graphed a line using the slope and a point. Now that we know how to find the slope and y-intercept of a line from its equation, we can use the y-intercept as the point, and then count out the slope from there.
Graph the line of the equation y = −x + 4 using its slope and y-intercept.
Solution (click to reveal)
| Steps | Algebraic |
| Formula | y = mx + b |
| The equation is in slope–intercept form. | y = −x + 4 |
| Identify the slope and y-intercept. | m = −1 y-intercept is (0, 4) |
| Plot the y-intercept. | See the graph. |
| Identify the rise over the run. | m = [latex]\displaystyle\frac{-1}{1}[/latex] |
| Count out the rise and run to mark the second point. Draw the line as shown in the graph. | rise −1, run 1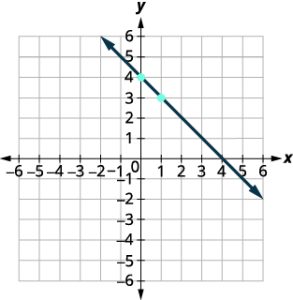 |
Graph the line of the equation y = −x − 3 using its slope and y-intercept.
Solution (click to reveal)
| Point-Plotting | Slope-Intercept | Intercepts | Recognize Vertical and Horizontal Lines |
| Create a blank table with two columns and four rows. The first row is labeled “x” and “y”. Find three points. Plot the points, make sure they line up, them draw the line. | y = mx + b
Find the slope and y-intercept, Start at the y-intercept, then count the slope to get a second point. |
Create a blank table with two columns and four rows. The first row is labeled “x” and “y”. Plug a zero in the first row in the x column. In the second row there is a 0 in the y column.
Find the intercepts and a 3rd point. Plot the points, make sure they line up, then draw the line.
|
The equation has only one variable.
x = a vertical. y = b horizontal. |
Vertical and Horizontal Lines[2]
Some linear equations have only one variable. They may have just x and no y, or just y without an x. This changes how we make a table of values to get the points to plot.
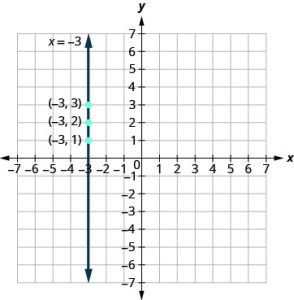
Let’s consider the equation x = −3. This equation has only one variable, x. The equation says that x is always equal to −3, so its value does not depend on y. No matter what is the value of y, the value of x is always −3.
So to make a table of values, write −3 in for all the x-values. Then choose any values for y. Since x does not depend on y, you can choose any numbers you like. But to fit the points on our coordinate graph, we’ll use 1, 2, and 3 for the y-coordinates.
| x | y | (x, y) |
| −3 | 1 | (−3, 1) |
| −3 | 2 | (−3, 2) |
| −3 | 3 | (−3, 3) |
Plot the points from the table and connect them with a straight line. Notice that we have graphed a vertical line.
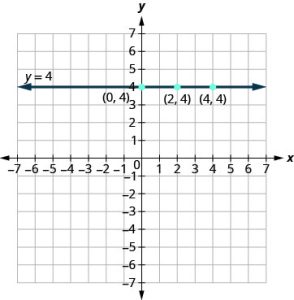
What if the equation has y but no x? Let’s graph the equation y=4. This time the y-value is a constant, so in this equation, y does not depend on x. Fill in 4 for all the y’s and then choose any values for x. We’ll use 0, 2, and 4 for the x-coordinates.
| x | y | (x, y) |
| 0 | 4 | (0, 4) |
| 2 | 4 | (2, 4) |
| 4 | 4 | (4, 4) |
In this figure, we have graphed a horizontal line passing through the y-axis at 4.
A vertical line is the graph of an equation of the form x = a. The line passes through the x-axis at (a, 0).
A horizontal line is the graph of an equation of the form y = b. The line passes through the y-axis at (0, b).
Try it!
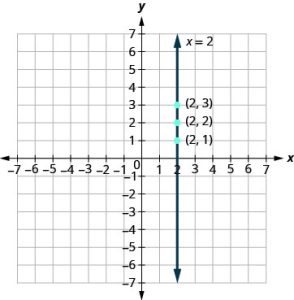
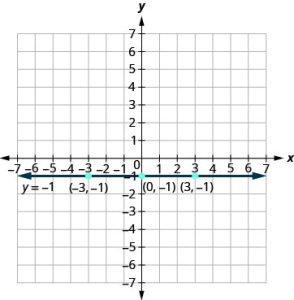
Graph: a. x = 2 b. y = −1.
Solution (click to reveal)
a. The equation has only one variable, x, and x is always equal to 2. We create a table where x is always 2 and then put in any values for y. The graph is a vertical line passing through the x-axis at 2.
| x | y | (x, y) |
| 2 | 1 | (2, 1) |
| 2 | 2 | (2, 2) |
| 2 | 3 | (2, 3) |
Solution (click to reveal)
b. Similarly, the equation y = −1 has only one variable, y. The value of y is constant. All the ordered pairs in the next table have the same y-coordinate. The graph is a horizontal line passing through the y-axis at −1.
| x | y | (x, y) |
| 0 | −1 | (0, −1) |
| 3 | −1 | (3, −1) |
| −3 | −1 | (−3, −1) |
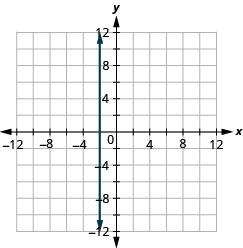
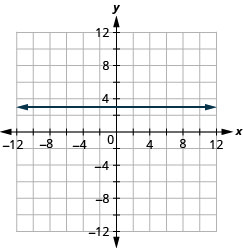
Graph the equations: a. x = −2 b. y = 3.
Solution A (click to reveal)
a.
Solution B (click to reveal)
b.
What is the difference between the equations y = 4x and y = 4?
The equation y = 4x has both x and y. The value of y depends on the value of x, so the y -coordinate changes according to the value of x. The equation y = 4 has only one variable. The value of y is constant, it does not depend on the value of x, so the y-coordinate is always 4.
| x | y | (x, y) |
| 0 | 0 | (0, 0) |
| 1 | 4 | (1, 4) |
| 2 | 8 | (2, 8) |
| x | y | (x, y) |
| 0 | 4 | (0, 4) |
| 1 | 4 | (1, 4) |
| 2 | 4 | (2, 4) |
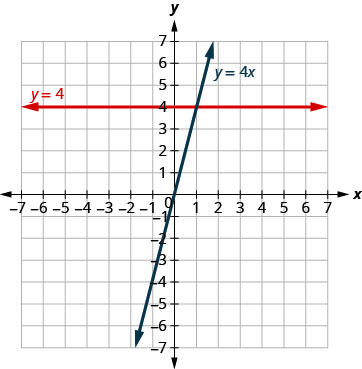 Notice, in the graph, the equation y = 4x gives a slanted line, while y = 4 gives a horizontal line.
Try it!
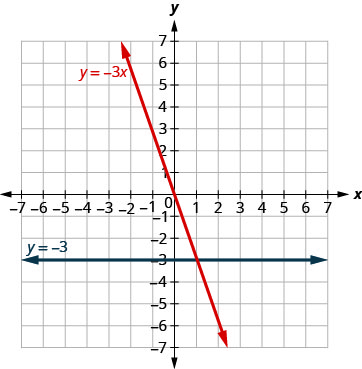
Graph y = −3x and y = −3 in the same rectangular coordinate system.
Solution (click to reveal)
We notice that the first equation has the variable x, while the second does not. We make a table of points for each equation and then graph the lines. The two graphs are shown.
y = -3x
| x | y | (x, y) |
| 0 | 0 | (0, 0) |
| 1 | -3 | (1, -3) |
| 2 | -6 | (2, -6) |
y = -3
| x | y | (x, y) |
| 0 | -3 | (0, -3) |
| 1 | -3 | (1, -3) |
| 2 | -3 | (2, -3) |
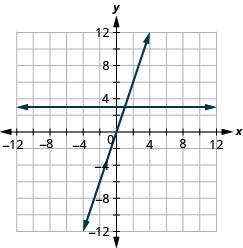
Graph the equations in the same rectangular coordinate system: y = 3 and y = 3x.
Solution (click to reveal)
Key Concepts
- Slope of a Line
- The slope of a line is m = [latex]\displaystyle\frac{\text{rise}}{\text{run}}[/latex] .
- The rise measures the vertical change and the run measures the horizontal change.
- How to find the slope of a line from its graph using m = [latex]\displaystyle\frac{\text{rise}}{\text{run}}[/latex].
- Locate two points on the line whose coordinates are integers.
- Starting with one point, sketch a right triangle, going from the first point to the second point.
- Count the rise and the run on the legs of the triangle.
- Take the ratio of rise to run to find the slope: m = [latex]\displaystyle\frac{\text{rise}}{\text{run}}[/latex].
- Slope of a line between two points.
- The slope of the line between two points (x1, y1) and (x2, y2) is:
m = [latex]\displaystyle\frac{y_2 - y_1}{x_2 - x_1}[/latex]
- The slope of the line between two points (x1, y1) and (x2, y2) is:
- How to graph a line given a point and the slope.
- Plot the given point.
- Use the slope formula m = [latex]\displaystyle\frac{\text{rise}}{\text{run}}[/latex] to identify the rise and the run.
- Starting at the given point, count out the rise and run to mark the second point.
- Connect the points with a line.
- Slope Intercept Form of an Equation of a Line
-
- The slope–intercept form of an equation of a line with slope m and y-intercept, (0, b) is y = mx + b
Point-Plotting Slope-Intercept Intercepts Recognize Vertical and Horizontal Lines Create a blank table with two columns and four rows. The first row is labeled “x” and “y”. Find three points. Plot the points, make sure they line up, them draw the line. y = mx + b Find the slope and y-intercept, Start at the y-intercept, then count the slope to get a second point.
Create a blank table with two columns and four rows. The first row is labeled “x” and “y”. Plug a zero in the first row in the x column. In the second row there is a 0 in the y column. Find the intercepts and a 3rd point. Plot the points, make sure they line up, then draw the line.
The equation has only one variable. x = a vertical.
y = b horizontal.
We have seen that we can use either the slope-intercept form or the point-slope form to find an equation of a line. Which form we use will depend on the information we are given.
To Write an Equation of a Line If given: Use: Form: Slope and y-intercept slope-intercept y = mx + b Slope and a point point-slope y − y1 = m(x − x1) Two points point-slope y − y1 = m(x − x1) -
Topics Covered:[3]
Recognize the Graph of a Quadratic Function[4]
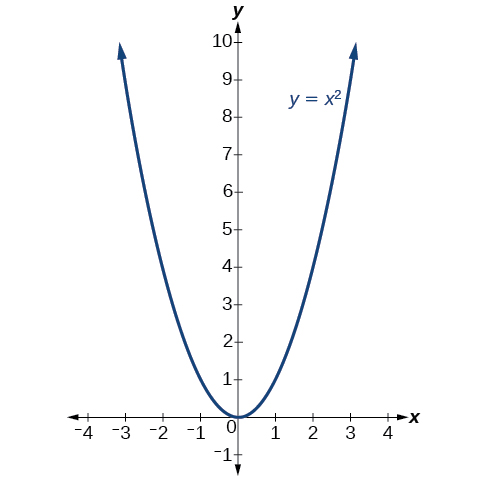
Previously we very briefly looked at the function [latex]\displaystyle f(x) = x^2[/latex], which we called the square function. It was one of the first non-linear functions we looked at. Now we will graph functions of the form [latex]\displaystyle f(x) = a x^2+ bx + c[/latex] if [latex]\displaystyle a\ne 0[/latex]. We call this kind of function a quadratic function.
Quadratic Function
A quadratic function, where a, b, and c are real numbers and [latex]\displaystyle a\ne 0[/latex], is a function of the form
We graphed the quadratic function [latex]\displaystyle f(x) = x^2[/latex] by plotting points.
| x | f(x) = x2 | (x , f(x)) |
| -3 | 9 | (-3, 9) |
| -2 | 4 | (-2, 4) |
| -1 | 1 | (-1, 1) |
| 0 | 0 | (0, 0) |
| 1 | 1 | (1, 1) |
| 2 | 4 | (2, 4) |
| 3 | 9 | (3, 9) |
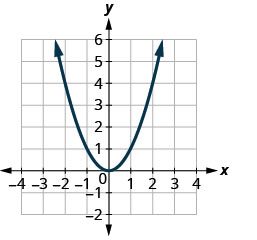
Every quadratic function has a graph that looks like this. We call this figure a parabola. Let’s practice graphing a parabola by plotting a few points.
Try it!
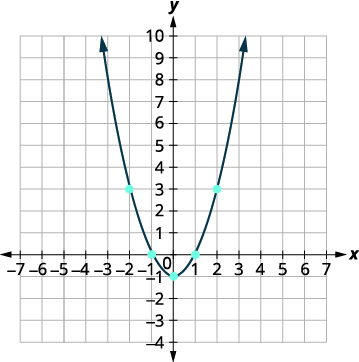
Graph [latex]\displaystyle f(x)=x^2 - 1[/latex]
Solution (click to reveal)
We will graph the function by plotting points.
Step 1: Choose integer values for x, substitute them into the equation and simplify to find [latex]\displaystyle f(x)[/latex]. Record the values of the ordered pairs in the chart.
| x | f(x) |
| 0 | -1 |
| 1 | 0 |
| -1 | 0 |
| 2 | 3 |
| 2 | 3 |
Step 2: Plot the points, and then connect them with a smooth curve. The result will be the graph of the function [latex]\displaystyle f(x)=x^2 - 1[/latex]
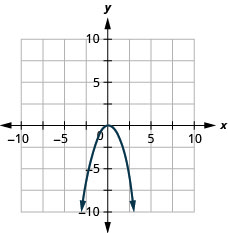
Graph [latex] f(x) = -x^2[/latex].
Solution (click to reveal)
The graph of a quadratic function is a U-shaped curve called a parabola. One important feature of the graph is that it has an extreme point called the vertex. If the parabola opens up, the vertex represents the lowest point on the graph or the minimum value of the quadratic function. If the parabola opens down, the vertex represents the highest point on the graph or the maximum value. In either case, the vertex is a turning point on the graph. The graph is also symmetric with a vertical line drawn through the vertex, called the axis of symmetry. These features are illustrated in the graph below.
The y-intercept is the point at which the parabola crosses the y-axis. The x-intercepts are the points at which the parabola crosses the x-axis. If they exist, the x-intercepts represent the zeros, or roots of the quadratic function, the values of x at which y = 0.
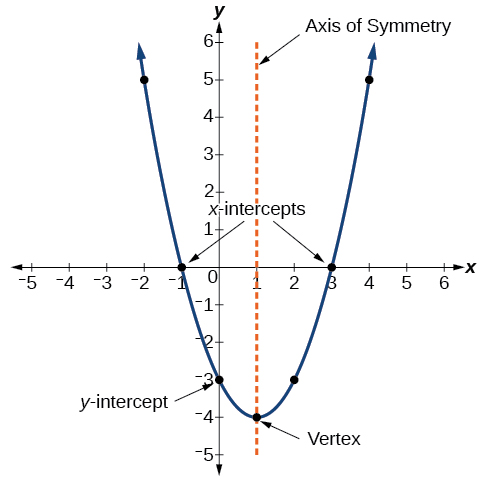
Try it! - Identifying the Characteristics of a Parabola
Determine the vertex, axis of symmetry, zeros, and y-intercept of the parabola shown in the graph below.
Solution (click to reveal)
The vertex is the turning point of the graph. We can see that the vertex is at (3, 1). Because this parabola opens upward, the vertex is a minimum point. The axis of symmetry is the vertical line that intersects the parabola at the vertex. So the axis of symmetry is x = 3. This parabola does not cross the x-axis, so it has no zeros. It crosses the y-axis at (0, 7), so, this is the y-intercept.
All graphs of quadratic functions of the form f(x) = ax2 + bx + c are parabolas that open upward or downward, as shown in the graph below.
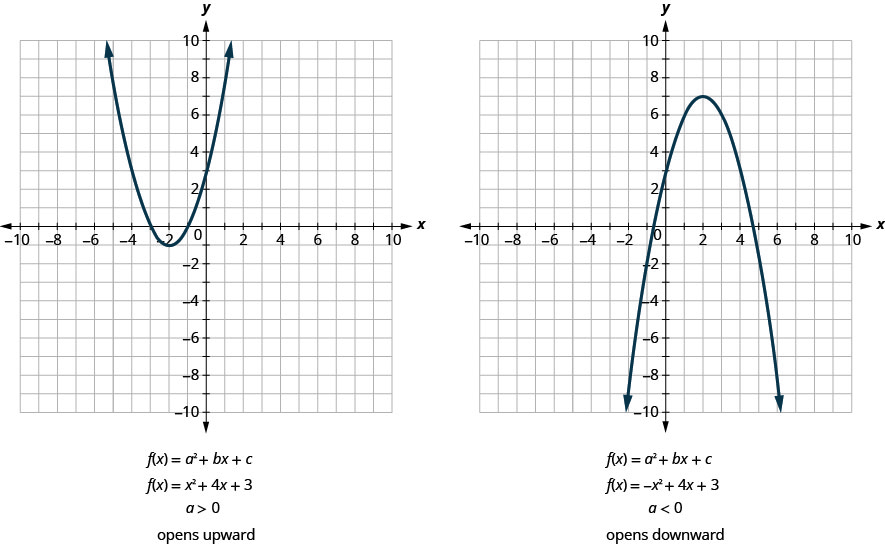
Notice that the only difference in the two functions is the negative sign before the quadratic term (x2 in the equation of the graph above). When the quadratic term is positive, the parabola opens upward, and when the quadratic term is negative, the parabola opens downward.
Parabola Orientation
For the graph of the quadratic function f (x) = ax2 + bx + c, if:
a > 0, the parabola opens upward![]()
a < 0, the parabola opens downward ![]()
Try it!
Determine whether each parabola opens upward or downward:
a. [latex]\displaystyle f(x) = -3x^2 + 2x - 4[/latex]
b. [latex]\displaystyle f(x) = 6x^2 + 7x - 9[/latex].
Solution A (click to reveal)
a.
| Steps | Algebraic |
| Find the value of “a”. | [latex]\begin{align*} f(x) &= {\color{myred1}ax^2 + bx + c} \\ f(x) &= -3x^2 + 2x -4 \\ a &= -3 \end{align*}[/latex] |
| Solution | Since the “a” is negative, the parabola will open downward. |
Solution B (click to reveal)
b.
| Steps | Algebraic |
| Find the value of “a”. | [latex]\begin{align*} f(x) &= {\color{myred1}ax^2 + bx + c} \\ f(x) &= 6x^2 + 7x - 9 \\ a &= 6 \end{align*}[/latex] |
| Solution | Since the “a” is positive, the parabola will open upward. |
2. Determine whether the graph of each function is a parabola that opens upward or downward:
a. [latex]\displaystyle f(x) = 2x^2 + 5x - 2[/latex]
b. [latex]\displaystyle f(x) = -3x^2 - 4x + 7[/latex].
Solution (click to reveal)
a. up
b. down
Find the Axis of Symmetry and Vertex of a Parabola
We will be looking at 2 forms of the quadratic function. The general form of a quadratic function presents the function in the form
f(x) = ax2 + bx +c
where a, b, and c are real numbers and a ≠ 0. If a > 0, the parabola opens upward. If a < 0, the parabola opens downward. We can use the general form of a parabola to find the equation for the axis of symmetry.
Look again at the previous graph. Do you see that we could fold each parabola in half and then one side would lie on top of the other? The ‘fold line’ is a line of symmetry. We call it the axis of symmetry of the parabola.
We show the same two graphs again with the axis of symmetry below.
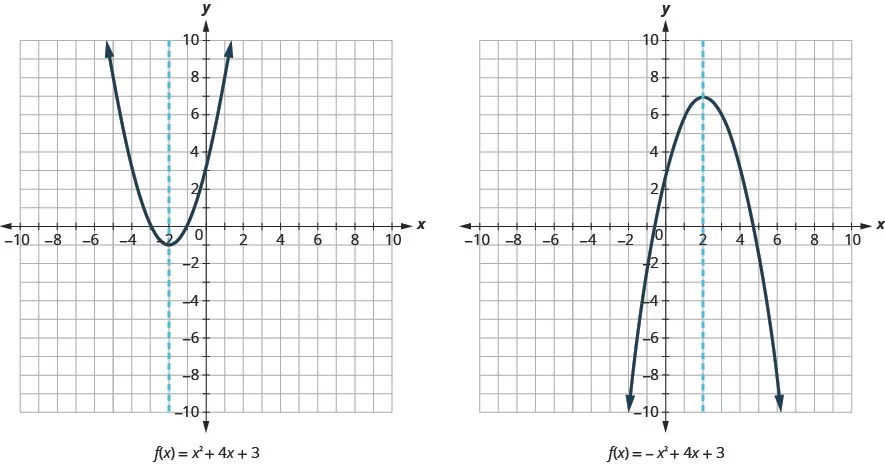
The axis of symmetry is defined by [latex]\displaystyle x= -\frac{b}{2a}[/latex]. If we use the quadratic formula, [latex]\displaystyle x= \frac{-b\pm\sqrt{b^2−-4ac}}{2a}[/latex], to solve ax2 + bx + c = 0 for the x-intercepts or zeros, we find the value of x halfway between them is always [latex]\displaystyle x = -\frac{b}{2a}[/latex], the equation for the axis of symmetry.
So to find the equation of symmetry of each of the parabolas we graphed above, we will substitute into the formula [latex]\displaystyle x = -\frac{b}{2a}[/latex].
| Steps | a >0 Example | a < 0 Example |
| Quadratic form | [latex]\displaystyle f(x) = ax^2 + bx + c[/latex] | [latex]\displaystyle f(x) = ax^2 + bx + c[/latex] |
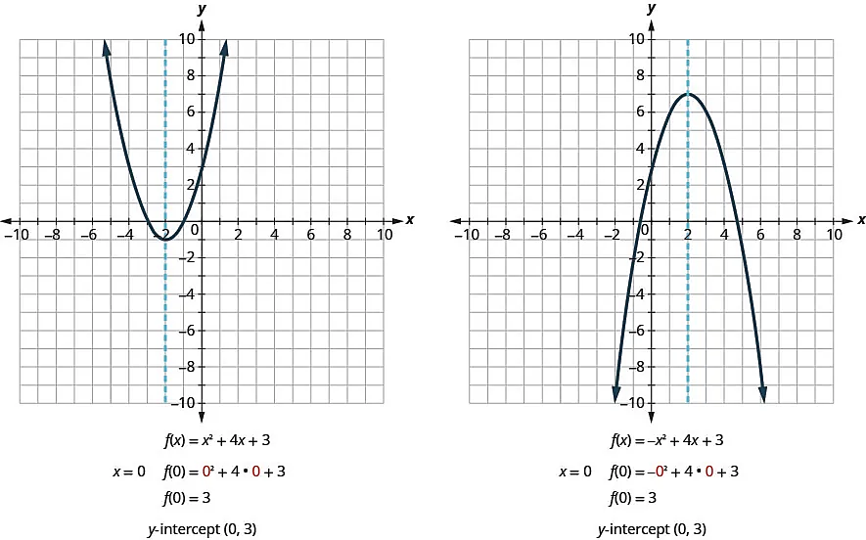
| Starting Equation | [latex]\displaystyle f(x) = x^2 + 4x + 3[/latex] | [latex]\displaystyle f(x) = -x^2 + 4x + 3[/latex] |
| Axis of Symmetry equation | The axis of symmetry is defined by [latex]\displaystyle x= -\frac{b}{2a}[/latex] | The axis of symmetry is defined by [latex]\displaystyle x= -\frac{b}{2a}[/latex] |
| Plug in the values for a & b into the equation | [latex]\displaystyle x= -\frac{4}{2.1}[/latex] | [latex]\displaystyle x= -\frac{4}{2{(-1)}}[/latex] |
| Simplify | [latex]\displaystyle x= -2[/latex] | [latex]\displaystyle x= 2[/latex] |
Notice that these are the equations of the dashed blue lines on the graphs.
The point on the parabola that is the lowest (parabola opens up), or the highest (parabola opens down), lies on the axis of symmetry. This point is called the vertex of the parabola.
 We can easily find the coordinates of the vertex because we know it is on the axis of symmetry. This means its x-coordinate is [latex]\displaystyle x = -\frac{b}{2a}[/latex]. To find the y-coordinate of the vertex we substitute the value of the x-coordinate into the quadratic function, as shown in the table below.
| Steps | a >0 Example | a < 0 Example |
| Starting Equation | [latex]\displaystyle f(x) = x^2 + 4x + 3[/latex] | [latex]\displaystyle f(x) = -x^2 + 4x + 3[/latex] |
| Axis of Symmetry (see previous table above) | The axis of symmetry is [latex]\displaystyle x= {\color{myred1}-2}[/latex] | The axis of symmetry is [latex]\displaystyle x= {\color{myred1}2}[/latex] |
| Vertex x-coordinate | The vertex is [latex]\displaystyle({\color{myred1}-2}, \_)[/latex] | The vertex is [latex]\displaystyle({\color{myred1}2}, \_)[/latex] |
| Repeat equation to find the y-coordinate | [latex]\displaystyle f(x) = x^2 + 4x + 3[/latex] | [latex]\displaystyle f(x) = -x^2 + 4x + 3[/latex] |
| Plug in Vertex x-coordinate | [latex]\displaystyle f(x) = ({\color{myred1}-2})^2 + 4({\color{myred1}-2}) + 3[/latex] | [latex]\displaystyle f(x) = -({\color{myred1}2})^2 + 4({\color{myred1}2}) + 3[/latex] |
| Simplify | [latex]\displaystyle f(x) = -1[/latex] | [latex]\displaystyle f(x) = 7[/latex] |
| Solution | The vertex is [latex]\displaystyle(-2, -1)[/latex] | The vertex is [latex]\displaystyle(-2, 7)[/latex] |
Axis of Symmetry and Vertex of a Parabola
The graph of the function f (x) = ax2 + bx + c is a parabola where:
- the axis of symmetry is the vertical line [latex]\displaystyle x = -\frac{b}{2a}[/latex].
- the vertex is a point on the axis of symmetry, so its x-coordinate is [latex]\displaystyle \frac{b}{2a}[/latex].
- the y-coordinate of the vertex is found by substituting [latex]\displaystyle x = -\frac{b}{2a}[/latex] into the quadratic equation.
Try it!
For the graph of f(x) = 3x2 − 6x + 2, find:
a. the axis of symmetry
b. the vertex.
Solution A (click to reveal)
a.
| Steps | Algebraic |
| Equation | [latex]\begin{align*} f(x) &= {\color{myred1}ax^2 + bx + c }\\ f(x) &= 3x^2 - 6x + 2 \end{align*}[/latex] |
| The axis of symmetry is the vertical line [latex]\displaystyle x= -\frac{b}{2a}[/latex].
Substitute the values of a, b into the equation. |
[latex]\displaystyle x = -\frac{-6}{2.3}[/latex] |
| Simplify. | [latex]\displaystyle x = 1[/latex] |
| Solution | The axis of symmetry is the line x = 1. |
Solution B (click to reveal)
b.
| Steps | Algebraic |
| Equation | [latex]\begin{align*} f(x) &= {\color{myred1}ax^2 + bx + c }\\ f(x) &= 3x^2 - 6x + 2 \end{align*}[/latex] |
| The vertex is a point on the line of symmetry, so its x-coordinate will be [latex] \displaystyle x= 1 [/latex].
Find f(1). |
[latex]\displaystyle f(x) = 3{(1)}^2 - 6{(1)} + 2[/latex] |
| Simplify. | [latex]\displaystyle f(x) = 3 . 1 - 6 + 2[/latex] |
| The result is the y-coordinate. | [latex]\displaystyle f(x) = -1[/latex] |
| Solution |
The vertex is (1, -1). |
For the graph of f(x) = 2x2 − 8x + 1, find:
a. the axis of symmetry
b. the vertex.
Solution (click to reveal)
a. x = 2
b. (2, −7)
Earlier in the chapter we mentioned we will see 2 forms of the quadratic function. We have already looked at the general form of the quadratic function; the second form is the Standard form (also called the Vertex form). The standard form of a quadratic function presents the function in the form
where(h, k) is the vertex. Because the vertex appears in the standard form of the quadratic function, this form is also known as the vertex form of a quadratic function.
As with the general form, if a > 0, the parabola opens upward, and the vertex is a minimum. If a < 0, the parabola opens downward, and the vertex is a maximum. The graph below represents the graph of the quadratic function written in standard form as y = -3(x + 2)2 + 4. Since x - h = x + 2 in this example, h = -2. In this form, a = -3, h = -2, and k = 4. Because a < 0, the parabola opens downward. The vertex is at (−2, 4).
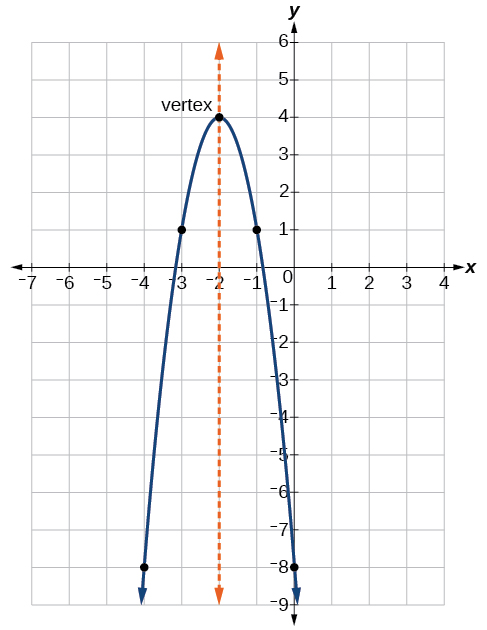
The standard form is useful for determining how the graph is transformed from the graph of y = x2. The graph shown below is that of this basic function.
The standard form and the general form are equivalent methods of describing the same function. We can see this by expanding out the general form and setting it equal to the standard form.
For the linear terms to be equal, the coefficients must be equal.
[latex]\displaystyle -2ah = b, \quad \text{ so }\quad h = - \frac{b}{2a}[/latex]
This is the axis of symmetry we defined earlier. Setting the constant terms equal:
[latex]\begin{align*} ah^2 + k &= c \\ k &= c - ah^2\\ &= c - a - \left(\frac{b}{2a}\right)^2\\ &= c - \frac{b^2}{4a} \end{align*}[/latex]
In practice, though, it is usually easier to remember that k is the output value of the function when the input is h, so f(h) = k.
Forms of Quadratic Functions
A quadratic function is a polynomial function of degree two. The graph of a quadratic function is a parabola.
The general form of a quadratic function is f(x) = ax2 + bx + c where a, b, and c are real numbers and a ≠ 0.
The standard form of a quadratic function is f(x) = a(x − h)2 + k where a ≠ 0.
The vertex (h, k) is located at
How to find the vertex of the parabola, given a quadratic function.
- Identify a, b, and c.
- Find h, the x-coordinate of the vertex, by substituting a and b into [latex]\displaystyle h = - \frac{b}{2a}[/latex].
- Find k, the y-coordinate of the vertex, by evaluating [latex] \displaystyle k = f(h) = f \left(-\frac{b}{2a}\right)[/latex].
Try it! - Finding the Vertex of a Quadratic Function
Find the vertex of the quadratic function f(x) = 2x2 – 6x + 7. Rewrite the quadratic in standard form (vertex form).
Solution (click to reveal)
The horizontal coordinate of the vertex will be at
[latex]\begin{align*} h &= - \frac{b}{2a}\\ &= - \frac{-6}{2(2)}\\ &= \frac{6}{4}\\ &= \frac{3}{2} \end{align*}[/latex]
The vertical coordinate of the vertex will be at
[latex]\begin{align*} k &= f(h)\\ &= f\left(\frac{3}{2}\right) \\ &= 2\left(\frac{3}{2}\right) ^2 - 6\left(\frac{3}{2}\right) + 7 \\
&= \frac{5}{2} \end{align*}[/latex]
Rewriting into standard form, the stretch factor will be the same as the a in the original quadratic. First, find the horizontal coordinate of the vertex. Then find the vertical coordinate of the vertex. Substitute the values into standard form, using the "a" from the general form.
The standard form of a quadratic function prior to writing the function then becomes the following:
Given the equation g(x) = 13 + x2 − 6x, write the equation in general form and then in standard form.
Solution (click to reveal)
g(x) = x2 − 6x + 13 in general form; g(x) = (x − 3)2 + 4 in standard form
Find the Intercepts of a Parabola
When we graphed linear equations, we often used the x- and y-intercepts to help us graph the lines. Finding the coordinates of the intercepts will help us to graph parabolas, too.
Remember, at the y-intercept the value of x is zero. So to find the y-intercept, we substitute x = 0 into the function.
Let’s find the y-intercepts of the two parabolas shown in the graph below.
An x-intercept results when the value of f(x) is zero. To find an x-intercept, we let f(x) = 0. In other words, we will need to solve the equation 0 = ax2 + bx + c for x.
Solving quadratic equations like this is exactly what we have done earlier in this chapter!
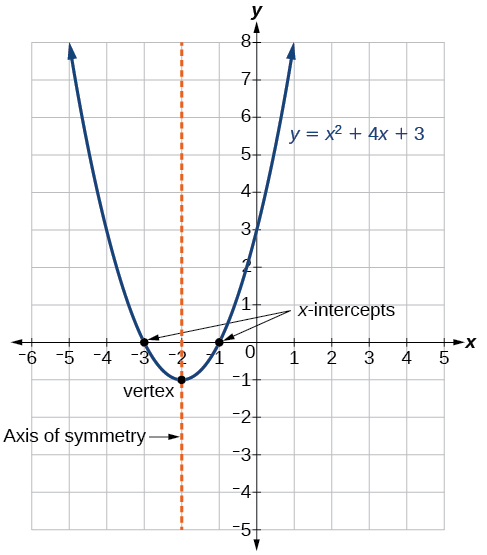
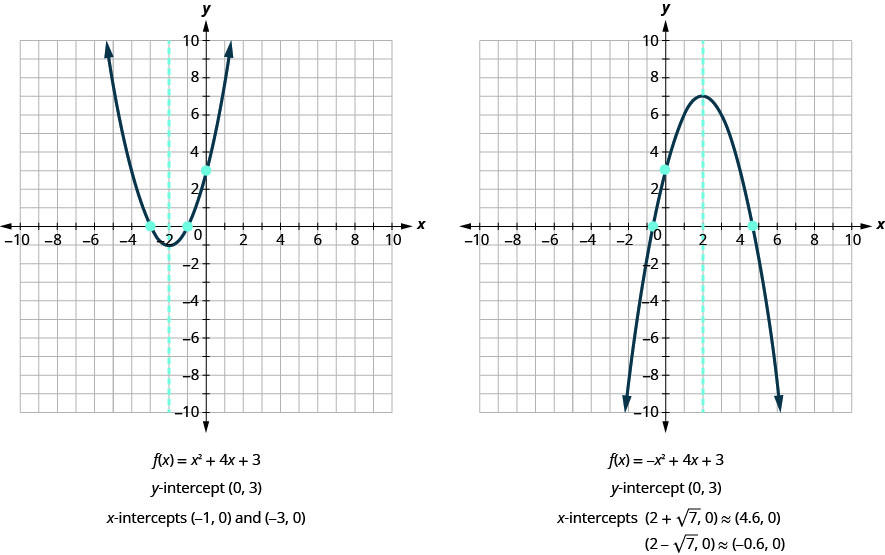
We can now find the x-intercepts of the two parabolas we looked at. First we will find the x-intercepts of the parabola whose function is f (x) = x2 + 4x + 3.
| Steps | Algebraic |
| Function | [latex]\displaystyle f(x) = x^2 + 4x + 3[/latex] |
| Let f(x) = 0, as indicated in red. | [latex]\displaystyle {\color{myred1}0} = x^2 + 4x + 3[/latex] |
| Factor. | [latex]\displaystyle 0 = {(x + 1)} {(x + 3)}[/latex] |
| Use the Zero Product Property. | [latex]\begin{align*} {x + 1} &= 0 \\ {x + 3} &= 0 \end{align*}[/latex] |
| Solve. | [latex]\begin{align*} x &= -1 \\ x &= -3 \end{align*}[/latex] |
| Solution | The x-intercepts are (−1, 0) and (−3, 0). |
Now we will find the x-intercepts of the parabola whose function is f (x) = -x2 + 4x + 3.
| Steps | Algebraic |
| Function | [latex]\displaystyle f(x) = -x^2 + 4x + 3[/latex] |
| Let f(x) = 0, as indicated in red. | [latex]\displaystyle {\color{myred1} 0} = -x^2 + 4x + 3[/latex] |
| This quadratic does not factor, so we use the Quadratic Formula. | [latex]\displaystyle x= \frac{-b\pm\sqrt{b^2−-4ac}}{2a}[/latex] |
| Substitute a = −1, b = 4, c = 3 | [latex]\displaystyle x= \frac{-4\pm\sqrt{4^2−-4(-1)(2)}}{2(-1)}[/latex] |
| Simplify | [latex]\begin{align*} x &= \frac{-4 \pm \sqrt{28}}{-2} \\ x &= \frac{-4 \pm 2\sqrt{7}}{-2} \\ x &= \frac{-2(2 \pm \sqrt{7})}{-2} \\ x &= 2 \pm \sqrt{7} \end{align*}[/latex] |
| Solution | The x-intercepts are [latex]\displaystyle (2 + \sqrt{7}, 0)[/latex] and [latex]\displaystyle (2 - \sqrt{7}, 0)[/latex]. |
We will use the decimal approximations of the x-intercepts so that we can locate these points on the graph,
Do these results agree with our graphs? See the graphs below.
Find the Intercepts of a Parabola
To find the intercepts of a parabola whose function is f(x) = ax2 + bx + c:
| y-intercept | x-intercepts |
| Let x = 0 and solve for f(x). | Let f(x) = 0 and solve for x. |
Try it!
Find the intercepts of the parabola whose function is f(x) = x2 − 2x − 8.
Solution (click to reveal)
| Steps | Algebraic |
| To find the y-intercept, | [latex]\displaystyle f(x) = x^2 - 2x - 8[/latex] |
| let x = 0, as indicated in red. | [latex]\displaystyle f(0) = {\color{myred1}0}^2 - 2({\color{myred1}0}) - 8[/latex] |
| and solve for f(x) | [latex]\displaystyle 0 = - 8[/latex] |
| When x = 0, then f(0) = −8. | The y-intercept is the point (0, −8). |
| To find the x-intercept, | [latex]\displaystyle f(x) = x^2 - 2x - 8[/latex] |
| Set equal to zero | [latex]\displaystyle 0 = x^2 - 2x - 8[/latex] |
| Solve by factoring. | [latex]\displaystyle 0 = {(x - 4)} {(x + 2)}[/latex] |
| Set each factor to zero and solve | [latex]\begin{align*} 0 &= x -4 \\ 0 &= x + 2 \end{align*}[/latex] |
| Solution | [latex]\begin{align*} 4 &= x \\ -2 &= x \end{align*}[/latex] |
| When f(x) = 0, then x = 4 or x = −2. | The x-intercepts are the points (4, 0) and (−2, 0). |
Find the intercepts of the parabola whose function is f(x) = x2 − 4x − 12.
Solution (click to reveal)
y-intercept: (0, −12) x-intercepts (−2, 0), (6, 0)
In this chapter, we have been looking at quadratic functions of the form f(x) = ax2 + bx + c. The graphs of these functions are parabolas. The x-intercepts of the parabolas occur where f(x) = 0.
Let's compare the quadratic equation to the quadratic function for comparison. For example:
| Quadratic equation | Steps | Quadratic function |
| x2 − 2x − 15 = 0 | Equation / Function |
f(x) = x2 − 2x − 15 |
| x2 − 2x − 15 = 0 | Let f(x) = 0 on the function to the right. | 0 = x2 − 2x − 15 |
| (x − 5) (x + 3) = 0 | Factor the equations | 0 = (x − 5) (x + 3) |
| x − 5 = 0 x + 3 = 0 | Simplify | x − 5 = 0 x + 3 = 0 |
| x = 5 x = −3 | Solution | x = 5 x = −3 |
| No further steps | For the function, we represent these as the x-intercepts. |
(5, 0) and (−3, 0) x-intercepts |
The solutions of the quadratic function are the x values of the x-intercepts.
Earlier, we saw that quadratic equations have 2, 1, or 0 solutions. The graphs below show examples of parabolas for these three cases. Since the solutions of the functions give the x-intercepts of the graphs, the number of x-intercepts is the same as the number of solutions.
Previously, we used the discriminant to determine the number of solutions of a quadratic function of the form ax2 + bx + c = 0. Now we can use the discriminant to tell us how many x-intercepts there are on the graph.
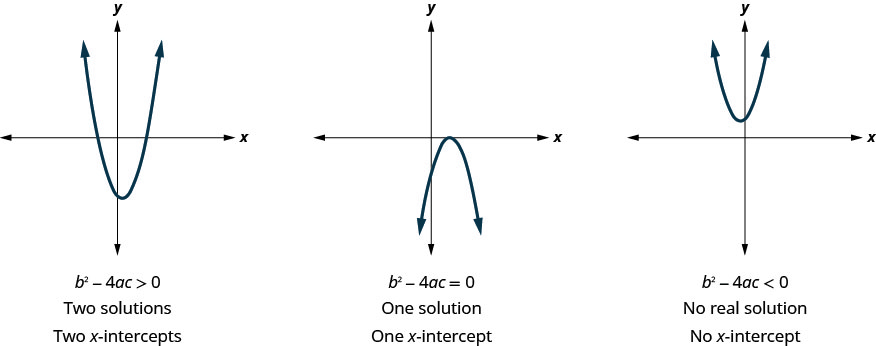
Before you find the values of the x-intercepts, you may want to evaluate the discriminant so you know how many solutions to expect.
Try it!
Find the intercepts of the parabola for the function f(x) = 5x2 + x + 4.
Solution (click to reveal)
| Steps | Algebraic |
| Function | [latex]\displaystyle f(x) = 5x^2 + x + 4[/latex] |
| To find the y-intercept, let x = 0, as indicated in red. | [latex]\displaystyle f(0) = 5.({\color{myred1}0})^2 + {\color{myred1}0} + 4[/latex] |
| Solve for f(x). | [latex]\displaystyle f(0) = 4[/latex] |
| Y-intercept? |
When x = 0, then f(0) = 4. The y-intercept is the point (0, 4). |
| Function - to find the x-intercept | [latex]\displaystyle f(x) = 5x^2 + x + 4[/latex] |
| To find the x-intercept, let f(x) = 0 and solve for x. | [latex]\displaystyle 0 = 5x^2 + x + 4[/latex] |
| Find the value of the discriminant to predict the number of solutions which is also the number of x-intercepts. |
b2 − 4ac 12 − 4 · 5 · 4 1 − 80 −79 |
| X-intercept? | Since the value of the discriminant is negative, there is no real solution to the equation. There are no x-intercepts. |
Find the intercepts of the parabola whose function is f(x) = 3x2 + 4x + 4.
Solution (click to reveal)
y-intercept: (0, 4) no x-intercept
Graph Quadratic Functions Using Properties
Now we have all the pieces we need in order to graph a quadratic function. We just need to put them together. In the next example we will see how to do this.
Try it! - How to Graph a Quadratic Function Using Properties
Graph f(x) = x2 − 6x + 8 by using its properties.
Solution (click to reveal)
| Steps | Algebraic |
| Step 1. Determine whether the parabola opens upward or downward: Look at a in the equation. [latex]\displaystyle f(x) = x^2 - 6x + 8[/latex] | [latex]\begin{gather*} f(x) = x^2 - 6x + 8\\ {\color{myred1}a = 1, b = -6, c = 8}\\\end{gather*} [/latex]
Since a is positive, the parabola opens upward. |
| Step 2. Find axis of symmetry: The axis of symmetry is the line [latex]\displaystyle x = -\frac{b}{2a}[/latex] | [latex]\begin{align*} x &= -\frac{b}{2a} \\ x &= -\frac{(-6)}{2 . 1} \\ x &= 3\end{align*}[/latex]
The axis of symmetry is the line x = 3 |
| Step 3. Find the vertex: The vertex is on the axis of symmetry. So substitute x = 3. | [latex]\begin{align*} f(x) &= x^2 -6x +8 \\ f(3) &= {\color{myred1}(3)}^2 - 6. {\color{myred1}(3)} + 8 \\ f(3) &= -1\end{align*}[/latex]
The vertex is (3, -1). |
| Step 4. Find the y-intercept. Find the point symmetric to the y-intercept across the axis of symmetry:
We find f(0). We use the axis of symmetry to find a point symmetric to the y-intercept. The y-intercept is 3 unit left of the axis of symmetry, x= 3. A point 3 unit to the right of the axis of symmetry has x = 6. |
[latex]\begin{align*} f(x) &= x^2 - 6x + 8 \\ f(0) & = {\color{myred1}(0)}^2 -6.{\color{myred1}0} + 8 \\ f(0) &= 8\end{align*}[/latex]
The y-intercept is (0, 8). Point symmetric to y-intercept: The point is (6, 8). |
| Step 5. Find the x-intercept and find additional points if needed:
We solve f(x) = 0, by factoring. |
[latex]\begin{align*} f(x) &= x^2 - 6x + 8 \\ 0 &= x^2 - 6x + 8 \\ 0 &= (x-2)(x-4) \\ x &= 2 \\ x &=4\end{align*}[/latex]
The x-intercepts are (2, 0) and (4, 0). |
| Step 6. Graph the parabola:
We graph the vertex, intercepts and the point symmetric to the y-intercept. W connect these 5 points to sketch the parabolas. |
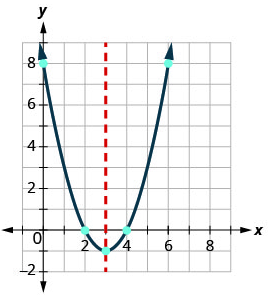 |
Graph f(x) = x2 − 8x + 12 by using its properties.
Solution (click to reveal)
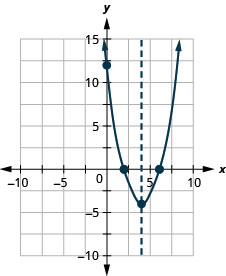
How to graph a quadratic function using properties.
- Determine whether the parabola opens upward or downward.
- Find the equation of the axis of symmetry.
- Find the vertex.
- Find the y-intercept. Find the point symmetric to the y-intercept across the axis of symmetry.
- Find the x-intercepts. Find additional points if needed.
- Graph the parabola.
We were able to find the x-intercepts in a previous example by factoring. We find the x-intercepts in the next example by factoring too.
Try it!
Graph f(x) = -x2 + 6x − 9 by using its properties.
Solution (click to reveal)
| Steps | Algebraic |
| Original Function | [latex]\begin{align*} f(x) &= {\color{myred1}ax^2 + bx + c}\\ f(x) &= -x^2 + 6x - 9 \end{align*}[/latex] |
| Since a = −1, the parabola opens downward. | |
| To find the equation of the axis of symmetry, use [latex]\displaystyle x = -\frac{b}{2a}[/latex] | [latex]\displaystyle x= -\frac{b}{2a}[/latex] |
| Plug-in the values for a and b | [latex]\displaystyle x= -\frac{6}{2(-1)}[/latex] |
| Simplify | [latex]\displaystyle x= 3[/latex] |
| Solution of vertex and axis of symmetry | The axis of symmetry is x = 3 and the vertex is on the line x = 3. |
| Graph the line |  |
| Original Function | [latex]\displaystyle f(x) = -x^2 + 6x - 9[/latex] |
| Find f(3), as indicated in red. | [latex]\displaystyle f(3) = 5. {\color{myred1}3}^2 + 6.{\color{myred1}3} - 9[/latex] |
| Simplify | [latex]\begin{align*} f(3) &= -9 + 18 - 9 \\ f(3) &= 0 \end{align*}[/latex] |
| Solution | The vertex is (3, 0) |
| Graph the Vertex. | 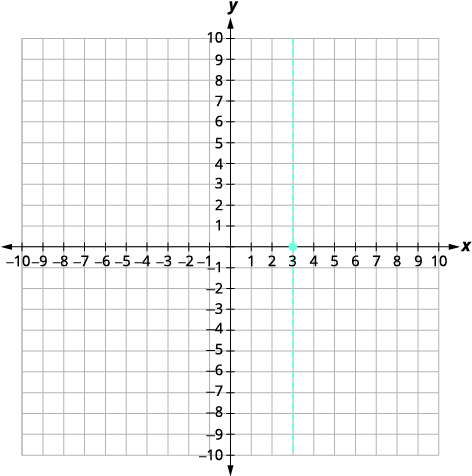 |
| The y-intercept occurs when x = 0. Find f(0). | [latex]\displaystyle f(x) = -x^2 + 6x - 9[/latex] |
| Substitute x = 0, as indicated in red. | [latex]\displaystyle f(0) = 5. {\color{myred1}0}^2 + 6.{\color{myred1}0} - 9[/latex] |
| Simplify | [latex]\displaystyle f(0) = - 9[/latex] |
| Solution | The y-intercept is (0,−9). |
| The point (0, −9) is three units to the left of the line of symmetry. The point three units to the right of the line of symmetry is (6, −9) and the point symmetric to the y-intercept. | 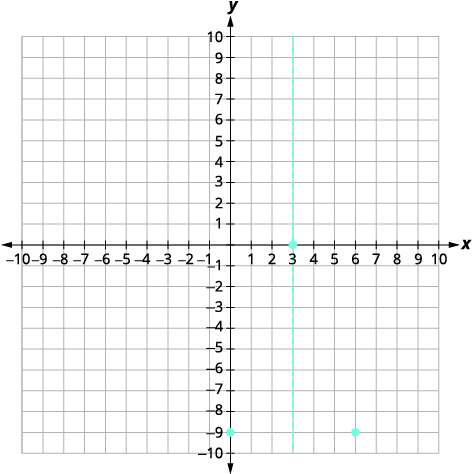 |
| The x-intercept occurs when f(x) = 0. | [latex]\displaystyle f(x) = -x^2 + 6x - 9[/latex] |
| Find f(x) = 0, as indicated in red. | [latex]\displaystyle {\color{myred1}0} = -x^2 + 6x - 9[/latex] |
| Factor the GCF. | [latex]\displaystyle 0 = (-x^2 + 6x - 9)[/latex] |
| Factor the trinomial. | [latex]\displaystyle 0 = -(x - 3)^2 [/latex] |
| Solve for x. | [latex]\displaystyle x = 3 [/latex] |
| Connect the points to graph the parabola. | 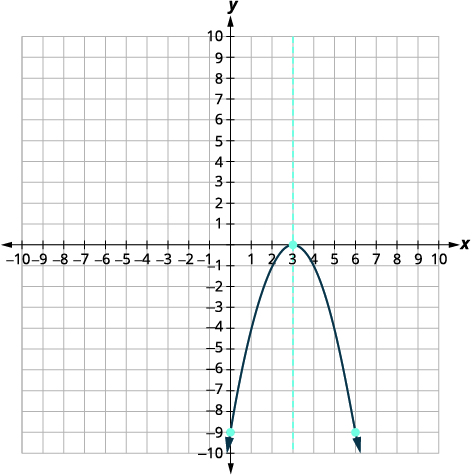 |
Graph f(x) = 3x2 + 12x − 12 by using its properties.
Solution (click to reveal)
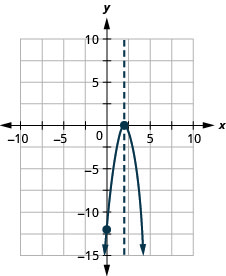
For the graph of f(x) = −x2 + 6x − 9, the vertex and the x-intercept were the same point. Remember how the discriminant determines the number of solutions of a quadratic equation? The discriminant of the equation 0 = −x2 + 6x − 9 is 0, so there is only one solution. That means there is only one x-intercept, and it is the vertex of the parabola.
How many x-intercepts would you expect to see on the graph of f(x) = x2 + 4x + 5?
Try it!
Graph f(x) = x2 + 4x + 5 by using its properties.
Solution (click to reveal)
| Steps | Algebraic |
| Original Function | [latex]\begin{align*} f(x) &= {\color{myred1}ax^2 + bx + c} \\ f(x) &= x^2 + 4x + 5 \end{align*}[/latex] |
| Since a = 1, the parabola opens upward. | |
| To find the equation of the axis of symmetry, use [latex]\displaystyle x = -\frac{b}{2a}[/latex] | [latex]\displaystyle x= -\frac{b}{2a}[/latex] |
| Plug-in the values for a and b | [latex]\displaystyle x= -\frac{4}{2(1)}[/latex] |
| Solution of vertex and axis of symmetry | [latex]\displaystyle x= -2[/latex] |
| Graph the line | 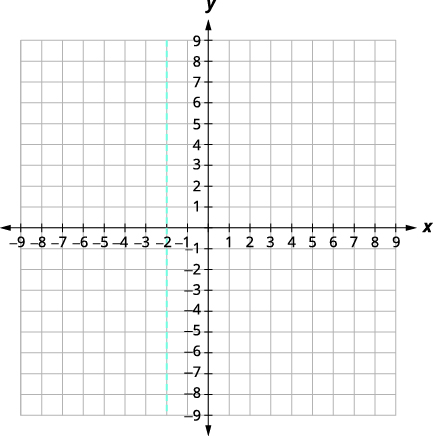 |
| Find f(x) when x = −2. | [latex]\displaystyle f(x) = x^2 + 4x + 5[/latex] |
| Plug-in x = −2, as indicated in red. | [latex]\displaystyle f(-2) = {\color{myred1}(-2)}^2 + 4.{\color{myred1}(-2)} + 5[/latex] |
| Simplify | [latex]\begin{align*} f(-2) &= 4 - 8 + 5 \\ f(-2) &= 1 \end{align*}[/latex] |
| Solution | The vertex is (−2, 1). |
| Graph the Vertex. | 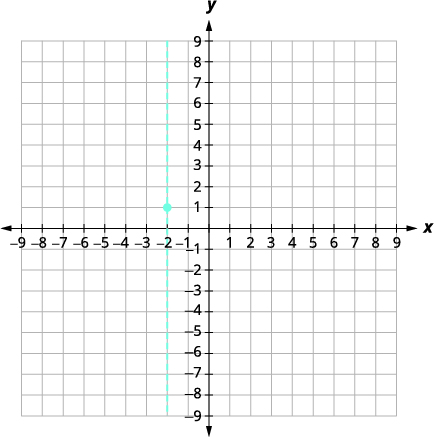 |
| The y-intercept occurs when x = 0. Find f(0). | [latex]\displaystyle f(x) = x^2 + 4x + 5[/latex] |
| Substitute x = 0. | [latex]\displaystyle f(0) = 5[/latex] |
| Solution | The y-intercept is (0, 5). |
| The point (−4, 5) is two units to the left of the line of symmetry.
The point two units to the right of the line of symmetry is (0, 5), point symmetric to the y-intercept |
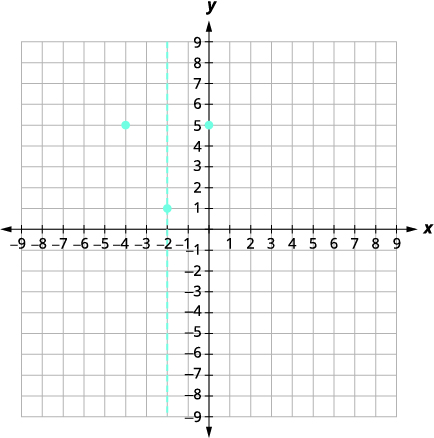 |
| The x-intercept occurs when f(x) = 0. Find f(x) = 0, as indicated in red. | [latex]\displaystyle {\color{myred1}0} = x^2 + 4x + 5[/latex] |
| Test the discriminant. | [latex]\displaystyle D = b^2 - 4ac[/latex] |
| Simplify | [latex]\begin{align*} D &= 4^2 - 4 . 1 . 5 \\ D &= 16 - 20 \\ D &= -4\end{align*}[/latex] |
| X-intercept? | Since the value of the discriminant is negative, there is no real solution and so no x-intercept. |
| Connect the points to graph the parabola. You may want to choose two more points for greater accuracy. | 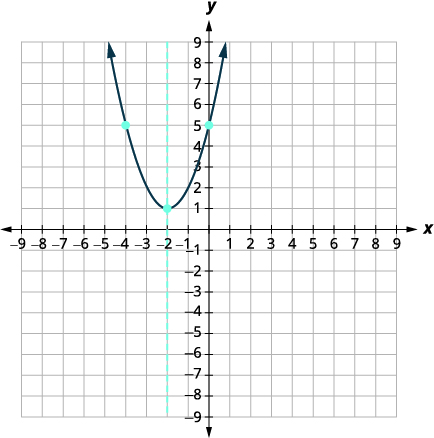 |
Graph f(x) = −3x2 − 6x − 4 by using its properties.
Solution (click to reveal)
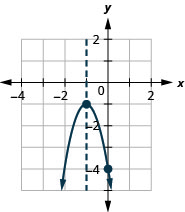
Finding the y-intercept by finding f(0) is easy, isn’t it? Sometimes we need to use the Quadratic Formula to find the x-intercepts.
Graph f(x) = 2x2 − 4x − 3 by using its properties.
Solution (click to reveal)
| Steps | Algebraic |
| Function | [latex]\begin{align*} f(x) &= {\color{myred1}ax^2 + bx + c }\\ f(x) &= 2x^2 - 4x - 3 \end{align*}[/latex] |
| Since a = 2, the parabola opens upward. | |
| To find the equation of the axis of symmetry, use [latex]\displaystyle x = -\frac{b}{2a}[/latex] | [latex]\displaystyle x= -\frac{b}{2a}[/latex] |
| Plug-in the values and Simplify | [latex]\displaystyle x= -\frac{-4}{2 . 2}[/latex] |
| The equation of the axis of symmetry is x = 1. | [latex]\displaystyle x= 1[/latex] |
| Original Function: The vertex is on the line x = 1. | [latex]\displaystyle f(x) = 2x^2 - 4x - 3[/latex] |
| Find f(1), as indicated in red. | [latex]\displaystyle f(1) = 2({\color{myred1}1})^2 - 4.{\color{myred1}1} - 3[/latex] |
| Simplify | [latex]\displaystyle f(1) = 2 - 4 - 3[/latex] |
| The vertex is (1, −5). | [latex]\displaystyle f(1) = -5[/latex] |
| Original Function: The y-intercept occurs when x = 0. | [latex]\displaystyle f(x) = 2x^2 - 4x - 3[/latex] |
| Find f(0), as indicated in red. | [latex]\displaystyle {\color{myred1}0} = 2.{\color{myred1}0}^2 - 4.{\color{myred1}0} - 3[/latex] |
| Simplify. The y-intercept is (0, −3). | [latex]\displaystyle f(0) = - 3[/latex] |
| The point (0, −3) is one unit to the left of the line of symmetry. The point one unit to the right of the line of symmetry is (2, −3). | Point symmetric to the y-intercept is (2, −3). |
| The x-intercept occurs when y = 0. | [latex]\displaystyle f(x) = 2x^2 - 4x - 3[/latex] |
| Find f(x) = 0, as indicated in red. | [latex]\displaystyle {\color{myred1}0} = 2x^2 - 4x - 3[/latex] |
| Use the Quadratic Formula. | [latex]\displaystyle x= \frac{-b\pm\sqrt{b^2−-4ac}}{2a}[/latex] |
| Substitute in the values of a, b and c. | [latex]\displaystyle x= \frac{-(-4)\pm\sqrt{(-4)^2−-4(2)(3)}}{2(2)}[/latex] |
| Simplify. | [latex]\displaystyle x= \frac{4\pm\sqrt{16 + 24}}{4}[/latex] |
| Simplify inside the radical. | [latex]\displaystyle x= \frac{4\pm\sqrt{40}}{4}[/latex] |
| Simplify the radical. | [latex]\displaystyle x= \frac{4\pm 2\sqrt{10}}{4}[/latex] |
| Factor the GCF. | [latex]\displaystyle x= \frac{2(2\pm\sqrt{10})}{4}[/latex] |
| Remove common factors. | [latex]\displaystyle x= \frac{2\pm\sqrt{10}}{2}[/latex] |
| Write as two equations. | [latex]\begin{align*} x &= \frac{2 + \sqrt{10}}{2} \\ x &= \frac{2 - \sqrt{10}}{2} \end{align*}[/latex] |
| Approximate the values. | [latex]\begin{align*} x &\approx 2.5 \\ x &\approx -0.6 \end{align*}[/latex] |
| Solution | The approximate values of the x-intercepts are (2.5, 0) and (−0.6, 0). |
| Graph the parabola using the points found. | 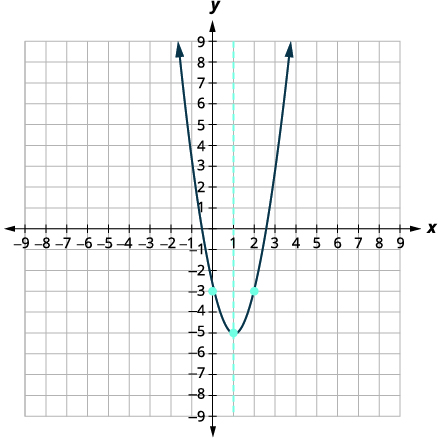 |
Graph f(x) = −3x2 − 6x + 5 by using its properties.
Solution (click to reveal)
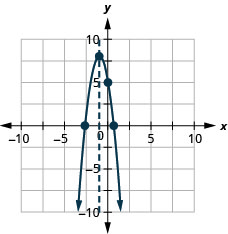
Solve Maximum and Minimum Applications
Knowing that the vertex of a parabola is the lowest or highest point of the parabola gives us an easy way to determine the minimum or maximum value of a quadratic function. The y-coordinate of the vertex is the minimum value of a parabola that opens upward. It is the maximum value of a parabola that opens downward. See the graphs below.
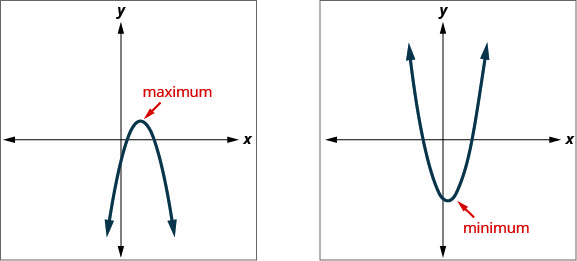
Minimum or Maximum Values of a Quadratic Function
The y-coordinate of the vertex of the graph of a quadratic function is the
- minimum value of the quadratic equation if the parabola opens upward.
- maximum value of the quadratic equation if the parabola opens downward.
So
[latex]\displaystyle f\left(\frac{-b}{2a}\right) [/latex]
is the Minimum or Maximum depending on the parabola's orientation.
Try it!
Find the minimum or maximum value of the quadratic function
f(x) = x2 + 2x − 8.
Solution (click to reveal)
| Steps | Algebraic |
| Function | [latex]\displaystyle f(x) = x^2 + 2x - 8[/latex] |
| Since a is positive, the parabola opens upward. |
The quadratic equation has a minimum. |
| Find the equation of the axis of symmetry. | [latex]\displaystyle x= -\frac{b}{2a}[/latex] |
| Plug-in the values | [latex]\displaystyle x= -\frac{2}{2 . 1}[/latex] |
| Solution: The equation of the axis of symmetry is x = −1. | [latex]\displaystyle x= -1[/latex] |
| The vertex is on the line x=−1. | [latex]\displaystyle f(x) = x^2 + 2x - 8[/latex] |
| Find f(−1), as indicated in red. | [latex]\displaystyle f(-1) = {\color{myred1}(-1)}^2 + 2{\color{myred1}(-1)} - 8[/latex] |
| Simplify | [latex]\displaystyle f(-1) = 1 - 2 - 8[/latex] |
| Solution: The vertex is (−1, −9). | [latex]\displaystyle f(-1) = - 9[/latex] |
| Since the parabola has a minimum, the y-coordinate of the vertex is the minimum y-value of the quadratic equation. |
The minimum value of the quadratic is −9 and it occurs when x = −1. |
| Show the graph to verify the result. | 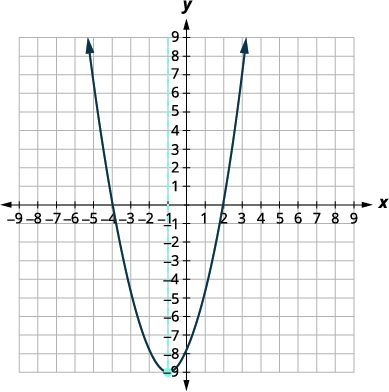 |
Find the maximum or minimum value of the quadratic function
f(x) = x2 − 8x + 12.
Solution (click to reveal)
The minimum value of the quadratic function is −4 and it occurs when x = 4.
Find the maximum or minimum value of the quadratic function
f(x) = −4x2 + 16x − 11.
Solution (click to reveal)
The maximum value of the quadratic function is 5 and it occurs when x = 2.
Access these online resources for additional instruction and practice with graphing quadratic functions using properties.
Key Concepts
- Parabola Orientation
- For the graph of the quadratic function f(x) = ax2 + bx +c, if
- a > 0, the parabola opens upward.
- a < 0, the parabola opens downward.
- For the graph of the quadratic function f(x) = ax2 + bx +c, if
- Axis of Symmetry and Vertex of a Parabola: The graph of the function f(x) = ax2 + bx +c is a parabola where:
- the axis of symmetry is the vertical line [latex]\displaystyle x = -\frac{b}{2a}[/latex].
- the vertex is a point on the axis of symmetry, so its x-coordinate is [latex]\displaystyle -\frac{b}{2a}[/latex].
- the y-coordinate of the vertex is found by substituting [latex]\displaystyle x = -\frac{b}{2a}[/latex] into the quadratic equation.
- Find the Intercepts of a Parabola
- To find the intercepts of a parabola whose function is f(x) = ax2 + bx + c:
y-intercept x-intercepts Let x = 0 and solve for f(x) Let f(x) = 0 and solve for x
- To find the intercepts of a parabola whose function is f(x) = ax2 + bx + c:
- How to graph a quadratic function using properties.
- Determine whether the parabola opens upward or downward.
- Find the equation of the axis of symmetry.
- Find the vertex.
- Find the y-intercept. Find the point symmetric to the y-intercept across the axis of symmetry.
- Find the x-intercepts. Find additional points if needed.
- Graph the parabola.
- Minimum or Maximum Values of a Quadratic Equation
- The y-coordinate of the vertex of the graph of a quadratic equation is the
- minimum value of the quadratic equation if the parabola opens upward.
- maximum value of the quadratic equation if the parabola opens downward.
