24 Sine and Periodic Functions:
Topics Covered
In case you missed something in class, or just want to review a specific topic covered in this Module, here is a list of topics covered:
Periodic and Sinusoidal Functions:[1]
With periodic or cyclical functions, the shape of the graph repeats after a set interval (period). So the Period represents the time/range it takes to complete one full cycle of an event. For example the shape of the sine function graph repeats after 2π, which means the functions are periodic with a period of 2π. The graphs below shows several periods of the sine and cosine functions.
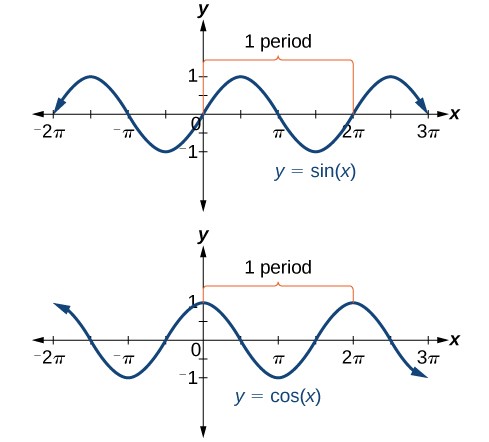
As we can see, the sine function is symmetric about the origin and the cosine function is symmetric about the y axis.
As we can see, sine and cosine functions have a regular period and range. If we watch ocean waves or ripples on a pond, we will see that they resemble the periodic function. However, they are not necessarily identical. Some are taller or longer than others. A function that has the same general shape as a sine or cosine function is known as a sinusoidal function. The general forms of sinusoidal functions are

where, A is the amplitude, B is the variable that determines the period, C specifies any horizontal shifts, and D specifies any vertical shifts.
Definitions: Determining the Period & Amplitude
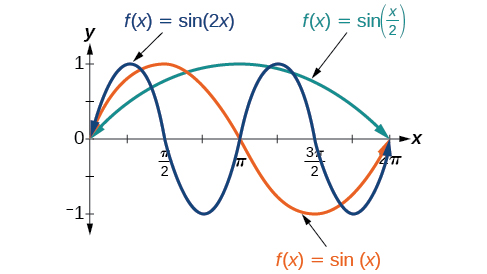
Let’s first start with the trigonometric explanation. In the general formula, B is related to the period by  . If
. If  then the period is less than
  and the function undergoes a horizontal compression, whereas if
  , then the period is greater than and the function undergoes a horizontal stretch. For example,
  , so the period is , which we knew. If
  , then B =
  , so the period is
  and the graph is compressed. If and the graph is stretched. Notice in the figure below how the period is indirectly related to
  .
.
Period of Sinusoidal Functions
If we let  and
and  in the general form equations of the sine and cosine functions, we obtain the forms

The period is  .
.
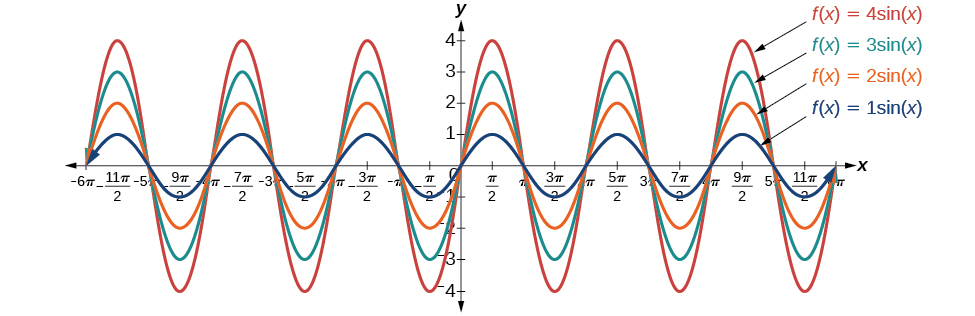
Returning to the general formula for a sinusoidal function, we have analyzed how the variable B relates to the period. Now let’s turn to the variable A so we can analyze how it is related to the amplitude or greatest distance from rest. A represents the vertical stretch factor, and its absolute value  is the amplitude. The local maxima will be a distance above the horizontal midline of the graph, which is the line
  ; because in this case, the midline is the
  -axis. The local minima will be the same distance below the midline. If
  , the function is stretched. For example, the amplitude of
  is twice the amplitude of
  . If
. If  , the function is compressed. The figure below compares several sine functions with different amplitudes.
Amplitude of Sinusoidal Functions
If we let and in the general form equation of the sine function, we obtain the form

The amplitude is A, and the vertical height from the midline is . In addition, notice in the example that

Amplitude and Period in Class
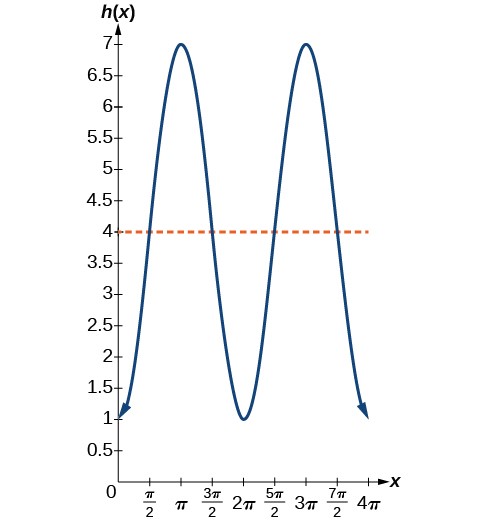
Now that you have seen the formulas and sine/cosine form of amplitude, midline and period, lets look at how you will encounter it with this class. For this class you will mainly focus on identifying period and amplitude from a graph, rather than the equation. For example, look at the following graph of a periodic function.
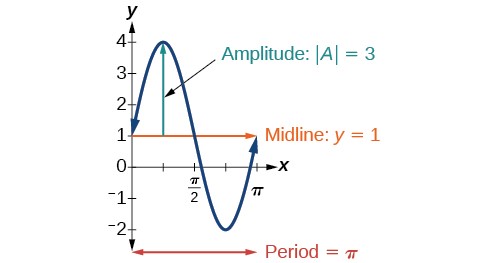
The midline in this example is the distance halfway between the maximum and minimum values on the graph. In the above example the midline is located at y = 1, as the maximum value is 4, and minimum value is -2. The period as we know is the interval of a cycle before the curve repeats. In the graph above, the cycle repeats at π. The last term we want to understand is amplitude. In the graph above you can see that it is represented by the distance from the midline to the maximum value of the curve. If midline is at 1, and the maximum value is 4, then the distance between them is a value of 3.
Lets try an example.
Try it!
Determine the amplitude, period, and midline for the graph shown.
![A sinusoidal graph with amplitude of 2, range of [-5, -1], period of 4, and midline at y=-3.](https://utsa.pressbooks.pub/app/uploads/sites/97/2024/09/wave-ex.-1.jpg)
Solution (click to reveal)
amplitude: 2; midline: y = −3; period: 4
#2. Determine the amplitude, period, midline for the graph shown.
![A graph with a cosine parent function with an amplitude of 2, period of 5, midline at y=3, and a range of [1,5].](https://utsa.pressbooks.pub/app/uploads/sites/97/2024/09/wave-ex-2.jpg)
Solution (click to reveal)
Solution:
amplitude: 2; period: 5; midline: y=3;
We can also apply this to other examples of periodic or cyclical functions.
Try it! -Finding the Vertical Component of Circular Motion
A circle with radius 3 ft is mounted with its center 4 ft off the ground. The point closest to the ground is labeled P. Sketch a graph of the height above the ground of the point P as the circle is rotated; then find the amplitude and period.
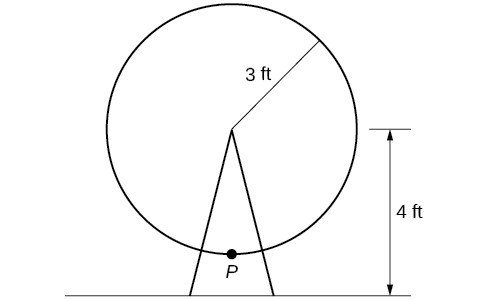
Solution (click to reveal)
Solution Sketching the height, we note that it will start 1 ft above the ground, then increase up to 7 ft above the ground, and continue to oscillate 3 ft above and below the center value of 4 ft.
We see that the graph oscillates 3 above and below the center, so amplitude is 3. Period would be 2π.
Try it! Determining a Rider’s Height on a Ferris Wheel
The London Eye is a huge Ferris wheel with a diameter of 135 meters (443 feet). It completes one rotation every 30 minutes. Riders board from a platform 2 meters above the ground. Express a rider’s height above ground as a function of time in minutes. Determine what is the maximum and minimum height above the ground a passenger would be when riding, and then use the above to find the period, midline, amplitude.
Solution (click to reveal)
With a diameter of 135 m, the wheel has a radius of 67.5 m. The height will oscillate with amplitude 67.5 m above and below the center.
Passengers board 2 m above ground level, so the center of the wheel must be located 67.5+2 = 69.5 m above ground level. The midline of the oscillation will be at 69.5 m.
The wheel takes 30 minutes to complete 1 revolution, so the height will oscillate with a period of 30 minutes.
Amplitude: 67.5
Midline: 69.5
Period: 30
Max. Height: 137 (m)
Min. Height: 2 (m)
Key Concepts
- Periodic functions repeat after a given value. The smallest such value is the period. The basic sine function has a period of 2π.
- The function
 is odd, so its graph is symmetric about the origin.
 - The graph of a sinusoidal function has the same general shape as a sine or cosine function.
- A function can be graphed by identifying its amplitude and period.
- Midline is the distance halfway between the maximum and minimum values on the graph.
- The period as we know is the interval of a cycle before the curve repeats.
- The amplitude is represented by the distance from the midline to the maximum value of the curve.
- Chapter material derived from Openstax Precalculus: Periodic Functions-Graphs of the Sine and Cosine Functions; Access for free at https://openstax.org/books/precalculus-2e/pages/1-introduction-to-functions ↵
