19 Slope Basics
Topics Covered[1]
In case you missed something in class, or just want to review a specific topic covered in this Module, here is a list of topics covered:
Introduction
We defined in the last chapter the various ways data can be represented in math: Verbal, numerical/tabular, graphical, algebraic/symbolic. We explored the basics of the graphical representation and some of the tabular in the previous section. Now we expand on that with slope.
Defining Slope[2]
In mathematics, the measure of the rate of change, or steepness, of a line is called the slope of the line.
The concept of slope has many applications in the real world. In construction, the pitch of a roof, the slant of the plumbing pipes, and the steepness of the stairs are all applications of slope. And as you ski or jog down a hill, you definitely experience a slope.
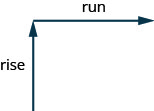
We can assign a numerical value to the slope of a line by finding the ratio of the rise and run. The rise is the amount the vertical distance changes while the run measures the horizontal change, as shown in this illustration. The slope is a rate of change. See picture below.
Slope of a Line
The slope of a line is m = rise  run.
run.
The rise measures the vertical change and the run measures the horizontal change. Creating a ratio out of these values gives us the rate of change of the line.
There are multiple methods to find the slope of a line depending on the type of representation presented.
In the next example, to find the slope of a line, we locate two points on the line whose coordinates are integers. Then we sketch a right triangle where the two points are vertices and one side is horizontal and one side is vertical.
Try it! – Finding the Slope of a Line
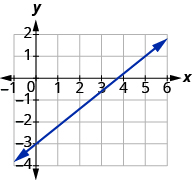
Find the slope of the line shown.
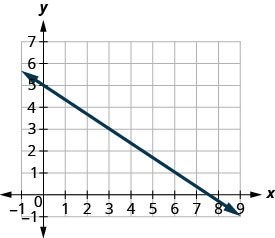
Solution
| Steps | Algebraic |
| Locate two points on the graph whose coordinates are integers. |
(0, 5) and (3, 3) |
| Starting at (0, 5), sketch a right triangle to (3, 3) as shown in this graph. |
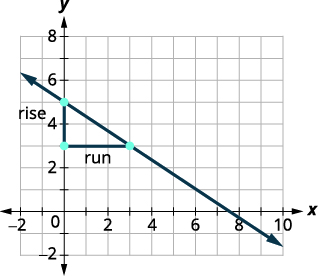 |
| Count the rise— since it goes down, it is negative. | The rise is −2. |
| Count the run. | The run is 3. |
| Use the slope formula. |  |
| Substitute the values of the rise and run. |  |
| Simplify. | |
| The slope of the line is −23. | |
| So, y decreases by 2 units as x increases by 3 units. |
How To:
Find the slope of a line from its graph using .
- Locate two points on the line whose coordinates are integers.
- Starting with one point, sketch a right triangle, going from the first point to the second point.
- Count the rise and the run on the legs of the triangle.
- Take the ratio of rise to run to find the slope: .
Try it! – Finding Slope with an Integer y-intercept
Find the slope of the line shown:
Solution
| Steps | Algebraic |
| Locate two points on the graph, choosing points whose coordinates are integers. | (0, −3) and (5, 1) |
| Starting with the point on the left, (0, −3), sketch a right triangle, going from the first point to the second point, (5, 1). | 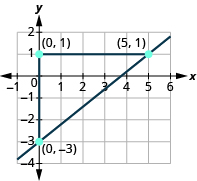 |
| Count the rise on the vertical leg of the triangle. | The rise is 4 units. |
| Count the run on the horizontal leg. | The run is 5 units. |
| Use the slope formula. | |
| Substitute the values of the rise and run. |  |
| The slope of the line is 45. |
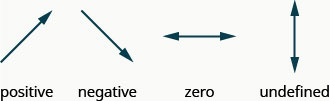
Notice that the slope is positive since the line slants upward from left to right.
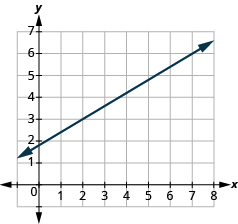
Try it! – Finding Slope without an Integer y-intercept
Find the slope of the line shown:
Solution
| Steps | Algebraic |
| Locate two points on the graph whose coordinates are integers. | (2, 3) and (7, 6) |
| Which point is on the left? | (2, 3) |
| Starting at (2, 3), sketch a right angle to (7, 6) as shown below. | 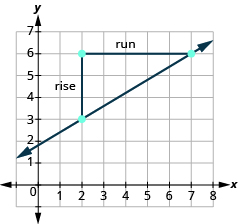 |
| Count the rise. | The rise is 3. |
| Count the run. | The run is 5. |
| Use the slope formula. | |
| Substitute the values of the rise and run. | m = 35 |
| The slope of the line is 35. |
Some lines are not at an angle but are either completely vertical or horizontal. These are special kinds of slope because the numerical equations will only ever have one variable; either just the x or y.
The Slope of a Horizontal Line
The slope of a horizontal line, y = b, is 0.
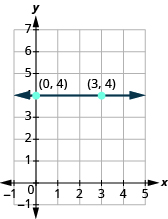
| Steps | Algebraic |
| What is the rise? | The rise is 0 |
| What is the run? | The run is 3. |
| The slop is 0. |  |
| What is the slope? | . All horizontal lines have slope 0. When the y-coordinates are the same, the rise is 0. |
The Slope of a Vertical Line
The slope of a vertical line, x = a, is undefined.
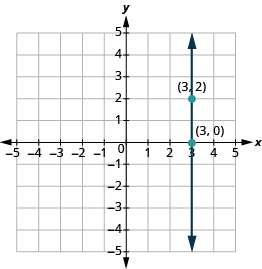
| Steps | Algebraic |
| What is the rise? | The rise is 2. |
| What is the run? | The run is 0. |
| What is the slope? | |
 |
All vertical lines have a slope undefined. When the x-coordinates are the same, the rise is undefined. This is because any number minus itself is zero and you cannot divide by 0.
The slope of a horizontal line, y = b, is 0.
The slope of a vertical line, x = a, is undefined.
Try it!
Find the slope of each line:
a. x = 8
b. y = −5.
Solution:
a. x = 8 This is a vertical line. Its slope is undefined.
b. y = −5 This is a horizontal line. It has slope 0.
The Slope from Two Points
We will use (x1,y1) to identify the first point and (x2,y2) to identify the second point.
Let’s see how the rise and run relate to the coordinates of the two points by taking another look at the slope of the line between the points (2,3) and (7,6), as shown in this graph.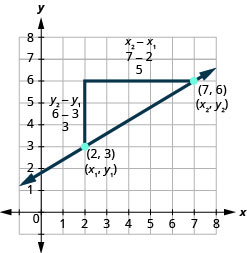
| Steps | Algebraic |
| Since we have two points, we will use subscript notation. | 
m = |
| On the graph, we counted the rise of 3 and the run of 5 | m =  |
| Notice that the rise of 3 can be found by subtracting they-coordinates, 6 and 3, and the run of 5 can be found by subtracting the x-coordinates 7 and 2. | |
| We rewrite the rise and run by putting in the coordinates. | m =  |
| But 6 isy2,they-coordinate of the second point and 3 isy1,the y-coordinate of the first point. So we can rewrite the slope using subscript notation. | m =  |
| Also 7 is the x-coordinate of the second point and 2 is the x-coordinate of the first point. So again we rewrite the slope using subscript notation. | m =  |
Slope Formula (Slope of a line between two points)
The slope of the line between two points (x1,y1) and (x2,y2) is:
OR
y of the second point minus y of the first point
over
x of the second point minus x of the first point.
Try it! – Finding the Slope of a Line with Two Points
Use the slope formula to find the slope of the line through the points (−2,−3) and (−7,4).
Solution:
| Steps | Algebraic |
| We’ll call (−2, −3) point #1 and (−7, 4) point #2. |  |
| Use the slope formula. | m = |
| Substitute the values.
y of the second point minus y of the first point x of the second point minus x of the first point |
m =  |
| Simplify. | m =  |
| Let’s verify this slope on the graph shown. | 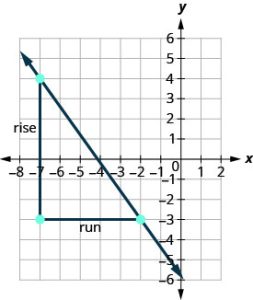 |
m = 
m = m = – |

Proportional Relationships with Slope[3]
Relationships are considered proportional relationships when the ratio between related sets of data values is constant.
To know if a relationship is proportional, look for the following aspects:
- Algebraic/symbolic representations (or equations) will tell you if they are proportional when you look at their y-intercept or the b.
- Proportional relationships will not have a y-intercept, or will not have a b value, or the b will be 0.
- Non-Proportional relationships will have a non-zero y-intercept.
- Numerical/tabular representations will have the coordinate pair (0, 0) in the table.
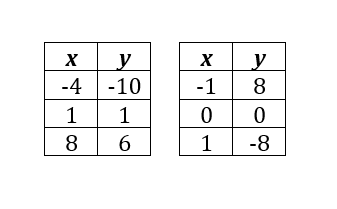
On the left is an example of a non-proportional numerical/tabular representation and on the right is an example of a proportional numerical/tabular representation.
- Graphical representations will show one of the following:
-
- Pass through the origin if it is proportional
- Not pass through the origin if it is non-proportional.
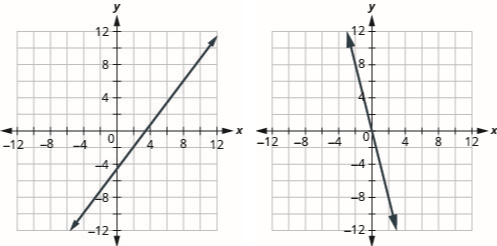
On the left is an example of a non-proportional graphical representation and on the right is an example of a proportional graphical representation. -
Rates of Change[4]
A rate of change is a relationship or unit rate that shows how one variable or quantity changes with another. The most common way to investigate rates of change is in numerical or tabular form of data, as demonstrated below.
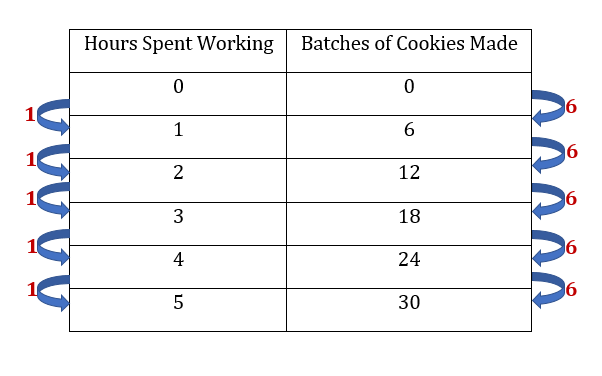
How the values of x change compared to how the values of y change is called the rate of change. From hour 1 to hour 2, 6 batches of cookies were made. From hour 2 to hour 3, 6 more batches were made. This relationship of change is often represented with a ratio where the dependent variable is in the numerator and the independent variable is in the denominator. The rate of change here would be:
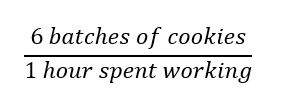
This ratio may appear similar to what was discussed in the previous section with slope, and that slope is sometimes described as rise over run.
We can assign a numerical value to the slope of a line by finding the ratio of the rise and run. The rise is the amount the vertical distance changes while the run measures the horizontal change. Slope is a rate of change.
The slope of a line, m, represents the vertical change in y over the horizontal change in x. Given two points, (x1,y1) and (x2,y2), the following formula determines the slope of a line containing these points:
m =
Slope also indicates the direction in which a line slants as well as its steepness.
So rate of change describes how an output quantity changes relative to the change in the input quantity. To find the average rate of change over the specified period of time, we divide the change in the output value by the change in the input value.
| Forms of Average rate of change (Slope) | =  . . |
=  |
|
| = |
The Greek letter Δ (delta) signifies the change in a quantity; we read the ratio as “delta-y over delta-x” or “the change in y divided by the change in x.”
Try it!
Gasoline costs have experienced some wild fluctuations over the last several decades. The table1 lists the average cost, in dollars, of a gallon of gasoline for the years 2005–2012. The cost of gasoline can be considered as a function of year.
| y | 2005 | 2006 | 2007 | 2008 | 2009 | 2010 | 2011 | 2012 |
|
C(y)
|
2.31 | 2.62 | 2.84 | 3.30 | 2.41 | 2.84 | 3.58 | 3.68 |
If we were interested only in how the gasoline prices changed between 2005 and 2012, we could compute that the cost per gallon had increased from $2.31 to $3.68, an increase of $1.37. While this is interesting, it might be more useful to look at how much the price changed per year.
In our example, the gasoline price increased by $1.37 from 2005 to 2012. Over 7 years, the average rate of change was
 ≈ 0.196 dollars per year
On average, the price of gas increased by about 19.6¢ each year.
Other examples of rates of change include:
- A population of rats increasing by 40 rats per week
- A car traveling 68 miles per hour (distance traveled changes by 68 miles each hour as time passes)
- A car driving 27 miles per gallon (distance traveled changes by 27 miles for each gallon)
- The current through an electrical circuit increasing by 0.125 amperes for every volt of increased voltage
- The amount of money in a college account decreasing by $4,000 per quarter
Rate of Change
A rate of change describes how an output quantity changes relative to the change in the input quantity. The units on a rate of change are “output units per input units.”
The average rate of change between two input values is the total change of the output values divided by the change in the input values.

Given the value of a function at different points, calculate the average rate of change of a function for the interval between two values x1 and x2.
- Calculate the difference y2 – y1 = Δy.
- Calculate the difference x2 – x1 = Δx.
- Find the ratio
Try it! – Computing an Average Rate of Change
Using the data in gasoline example above, find the average rate of change of the price of gasoline between 2007 and 2009.
| y | 2005 | 2006 | 2007 | 2008 | 2009 | 2010 | 2011 | 2012 |
|
C(y)
|
2.31 | 2.62 | 2.84 | 3.30 | 2.41 | 2.84 | 3.58 | 3.68 |
Solution:
In 2007, the price of gasoline was $2.84. In 2009, the cost was $2.41. The average rate of change is


= -$0.22 per year
Note that a decrease is expressed by a negative change or “negative increase.” A rate of change is negative when the output decreases as the input increases or when the output increases as the input decreases.
Try it! – Computing Average Rate of Change from a Table
After picking up a friend who lives 10 miles away and leaving on a trip, Anna records her distance from home over time. The values are shown in the table below. Find her average speed over the first 6 hours.
| t (hours) | D(t) (miles) |
| 0 | 10 |
| 1 | 55 |
| 2 | 90 |
| 3 | 153 |
| 4 | 214 |
| 5 | 240 |
| 6 | 292 |
| 7 | 300 |
Solution:
Here, the average speed is the average rate of change. She traveled 282 miles in 6 hours.

= 47
The average speed is 47 miles per hour.
Because the speed is not constant, the average speed depends on the interval chosen. For the interval [2,3], the average speed is 63 miles per hour.
Key Concepts
- Slope of a Line
- The slope of a line is m = .
- The rise measures the vertical change and the run measures the horizontal change.
- The slope of a line is m =
- How to find the slope of a line from its graph using m = .
- Locate two points on the line whose coordinates are integers.
- Starting with one point, sketch a right triangle, going from the first point to the second point.
- Count the rise and the run on the legs of the triangle.
- Take the ratio of rise to run to find the slope: m = .
- Slope of a line between two points.
- The slope of the line between two points (x1, y1) and (x2, y2) is:
m =
- The slope of the line between two points (x1, y1) and (x2, y2) is:
- Access for free at https://openstax.org/books/prealgebra-2e/pages/1-introduction ; Access for free at https://openstax.org/books/introductory-statistics-2e/pages/1-introduction ↵
- Section material derived from Openstax Introductory Statistics: The Linear Regression and Correlation-Linear Equations and Prealgebra: Graphs-Understand Slope of a Line ↵
- This material was created by Amanda Towry using the Microsoft Word processing program. ↵
- This material was created by Amanda Towry using the Microsoft Word processing program. updated Section material derived from Openstax Introductory Statistics: The Linear Regression and Correlation-Linear Equations and Prealgebra: Graphs-Understand Slope of a Line ↵
The slope of a line is [latex]m = \frac{\text{rise}}{\text{run}}[/latex]. The rise measures the vertical change and the run measures the horizontal change.
A mathematical relationship where the ratio between related sets of data values is constant.
Also known as algebraic representation, is a mathematical representation where information or relationships are presented using numbers and symbols such as in an algebraic equation.
A relationship or unit rate that shows how one variable or quantity changes with another.
