11 Ratios & Probabilities:
Topics Covered[1]
In case you missed something in class, or just want to review a specific topic covered in this Module, here is a list of topics covered:
Write a Ratio as a Fraction[2]
When you apply for a mortgage, the loan officer will compare your total debt to your total income to decide if you qualify for the loan. This comparison is called the debt-to-income ratio.
Ratio
 , or a:b.
In this section, we will use the fraction notation. When a ratio is written in fraction form, the fraction should be simplified. If it is an improper fraction, we do not change it to a mixed number. Because a ratio compares two quantities, we would leave a ratio as  instead of simplifying it to 4 so that we can see the two parts of the ratio. Which method you use often depends upon the situation. For the most part, we will want to write our ratios using the fraction notation. Note that, while all ratios are fractions, not all fractions are ratios. Ratios make part to part, part to whole, and whole to part comparisons. Fractions make part to whole comparisons only.
Try-it! -Writing Ratios as Fractions
Write each ratio as a fraction: a. 15 to 27 b. 45 to 18.
Solution
a.
| Steps | Algebraic |
| 15 to 27 | |
| Write as a fraction with the first number in the numerator and the second in the denominator. |  |
| Simplify the fraction. |  |
b.
| Steps | Algebraic |
| 45 to 18 | |
| Write as a fraction with the first number in the numerator and the second in the denominator. |  |
| Simplify. |  |
We leave the ratio in b. as an improper fraction.
Ratios Involving Decimals[3]
We will often work with ratios of decimals, especially when we have ratios involving money. In these cases, we can eliminate the decimals by using the Equivalent Fractions Property to convert the ratio to a fraction with whole numbers in the numerator and denominator.
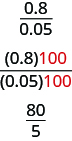
For example, consider the ratio 0.8 to 0.05. We can write it as a fraction with decimals and then multiply the numerator and denominator by 100 to eliminate the decimals.
 Do you see a shortcut to find the equivalent fraction? Notice that
  and
and  . The least common denominator of
  and
and  is 100. By multiplying the numerator and denominator of
  by 100, we ‘moved’ the decimal two places to the right to get the equivalent fraction with no decimals. Now that we understand the math behind the process, we can find the fraction with no decimals like this:
| Steps | Algebraic |
 |
|
| “Move” the decimal 2 places. |  |
| Simplify. |  |
You do not have to write out every step when you multiply the numerator and denominator by powers of ten. As long as you move both decimal places the same number of places, the ratio will remain the same.
Try-it! -Writing Ratios as Fractions
Write each ratio as a fraction of whole numbers:
a. 4.8 to 11.2
b. 2.7 to 0.54
| Steps | Algebraic |
| 4.8 to 11.2 | |
| Write as a fraction. |  |
| Rewrite as an equivalent fraction without decimals, by moving both decimal points 1 place to the right. |  |
| Simplify. |  |
So, 4.8 to 11.2 is equivalent to .
b.
| Steps | Algebraic |
| The numerator has one decimal place, and the denominator has 2. To clear both decimals we need to move the decimal 2 places to the right.
|
|
| Write as a fraction. |  |
| Move both decimals right two places. |  |
| Simplify. |  |
So, 2.7 to 0.54 is equivalent to .
The Relationship Between Fractions, Decimals, and Percents – Making Conversions[4]
Since a percent is a ratio, and a ratio can be written as a fraction, and a fraction can be written as a decimal, any of these forms can be converted to any other.
Before we proceed to the next section, let’s review the conversion techniques learned in Previous Units.
| To Convert a Fraction | To Convert a Decimal | To Convert a Percent |
| To a decimal: Divide the numerator by the denominator | To a fraction: Read the decimal and reduce the resulting fraction | To a decimal: Move the decimal point 2 places to the left and drop the % symbol |
| To a percent: Convert the fraction first to a decimal, then move the decimal point 2 places to the right and affix the % symbol. | To a percent: Move the decimal point 2 places to the right and affix the % symbol | To a fraction: Drop the % sign and write the number “over” 100. Reduce, if possible. |
Try it! – Convert Percent to Decimal
Convert 12% to a decimal.

Note that
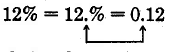
The % symbol is dropped, and the decimal point moves 2 places to the left.
Try it! – Convert a Decimal to Percent
Convert 0.75 to a percent.

Note that
![]() The % symbol is affixed, and the decimal point moves 2 units to the right.
The % symbol is affixed, and the decimal point moves 2 units to the right.
Try it! – Convert a Fraction to Percent
Convert  to a percent.
We have seen we can convert a decimal to a percent. We also know that we can convert a fraction to a decimal. Thus, we can see that if we first convert the fraction to a decimal, we can then convert the decimal to a percent.

Try it! – Convert Percent to a Fraction
Convert  to a fraction.

or

The Defintion of Probability[5]
Probability is a mathematical tool used to study randomness. It deals with the chance (the likelihood) of an event occurring. For example, if you toss a fair coin four times, the outcomes may not be two heads and two tails. However, if you toss the same coin 4,000 times, the outcomes will be close to half heads and half tails. The expected theoretical probability of heads in any one toss is  or 0.5. Even though the outcomes of a few repetitions are uncertain, there is a regular pattern of outcomes when there are many repetitions. After reading about the English statistician Karl Pearson who tossed a coin 24,000 times with a result of 12,012 heads, one of the authors tossed a coin 2,000 times. The results were 996 heads. The fraction
  is equal to 0.498 which is very close to 0.5, the expected probability.
The probability of an event tells us how likely that event is to occur. We usually write probabilities as fractions or decimals.
An event is any combination of outcomes. Upper case letters like A and B represent events. For example, if the experiment is to flip one fair coin, event A might be getting at most one head. The probability of an event A is written P(A).
For example, picture a fruit bowl that contains five pieces of fruit – three bananas and two apples.
If you want to choose one piece of fruit to eat for a snack and don’t care what it is, there is a probability you will choose a banana, because there are three bananas out of the total of five pieces of fruit. The probability of an event is the number of favorable outcomes divided by the total number of outcomes.
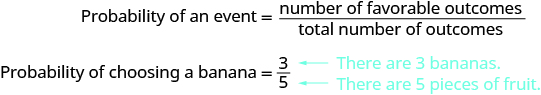
The probability of an event is the number of favorable outcomes divided by the total number of outcomes possible.

Converting the fraction 35 to a decimal, we would say there is a 0.6 probability of choosing a banana.

This basic definition of probability assumes that all the outcomes are equally likely to occur. If you study probabilities in a later math class, you’ll learn about several other ways to calculate probabilities.
Try-it! – Determining Probability
The ski club is holding a raffle to raise money. They sold 100 tickets. All of the tickets are placed in a jar. One ticket will be pulled out of the jar at random, and the winner will receive a prize. Cherie bought one raffle ticket.
a. Find the probability she will win the prize.
b. Convert the fraction to a decimal.
Solution
a.
| xxx | xxx |
| What are you asked to find? | The probability Cherie wins the prize. |
| What is the number of favorable outcomes? | 1, because Cherie has 1 ticket. |
| Use the definition of probability. |  |
| Substitute into the numerator and denominator. |  |
b.
| Steps | Algebraic |
| Convert the fraction to a decimal. | |
| Write the probability as a fraction. |  |
| Convert the fraction to a decimal. | Probability = 0.01 |
#2 Three women and five men interviewed for a job. One of the candidates will be offered the job.
a. Find the probability the job is offered to a woman.
b. Convert the fraction to a decimal.
Solution
a.
| xxx | xxx |
| What are you asked to find? | The probability the job is offered to a woman. |
| What is the number of favorable outcomes? | 3, because there are three women. |
| What are the total number of outcomes? | 8, because 8 people interviewed. |
| Use the definition of probability. | |
| Substitute into the numerator and denominator. |  |
b.
| Steps | Algebraic |
| Convert the fraction to a decimal. | |
| Write the probability as a fraction. | |
| Convert the fraction to a decimal. |  |
Independent Events[6]
Two events are independent if the following are true:
- P(A|B) = P(A)
- P(B|A) = P(B)
- P(A AND B) = P(A)P(B)
Two events A and B are independent if the knowledge that one occurred does not affect the chance the other occurs. For example, the outcomes of two roles of a fair die are independent events. The outcome of the first roll does not change the probability for the outcome of the second roll. To show two events are independent, you must show only one of the above conditions. If two events are NOT independent, then we say that they are dependent.
Sampling may be done with replacement or without replacement.
- With replacement: If each member of a population is replaced after it is picked, then that member has the possibility of being chosen more than once. When sampling is done with replacement, then events are considered to be independent, meaning the result of the first pick will not change the probabilities for the second pick.
- Without replacement: When sampling is done without replacement, each member of a population may be chosen only once. In this case, the probabilities for the second pick are affected by the result of the first pick. The events are considered to be dependent or not independent.
If it is not known whether A and B are independent or dependent, assume they are dependent until you can show otherwise.
Probability With and Without Replacement
a. Sampling with replacement:
Suppose you pick three cards with replacement. The first card you pick out of the 52 cards is the Q of spades. You put this card back, reshuffle the cards and pick a second card from the 52-card deck. It is the ten of clubs. You put this card back, reshuffle the cards and pick a third card from the 52-card deck. This time, the card is the Q of spades again. Your picks are {Q of spades, ten of clubs, Q of spades}. You have picked the Q of spades twice. You pick each card from the 52-card deck.
b. Sampling without replacement:
Suppose you pick three cards without replacement. The first card you pick out of the 52 cards is the K of hearts. You put this card aside and pick the second card from the 51 cards remaining in the deck. It is the three of diamonds. You put this card aside and pick the third card from the remaining 50 cards in the deck. The third card is the J of spades. Your picks are {K of hearts, three of diamonds, J of spades}. Because you have picked the cards without replacement, you cannot pick the same card twice.
Try-it!
You have a fair, well-shuffled deck of 52 cards. It consists of four suits. The suits are clubs, diamonds, hearts, and spades. There are 13 cards in each suit consisting of 1, 2, 3, 4, 5, 6, 7, 8, 9, 10, J (jack), Q (queen), and K (king) of that suit. S = spades, H = Hearts, D = Diamonds, C = Clubs.
a. Suppose you pick four cards, but do not put any cards back into the deck. Your cards are QS, 1D, 1C, QD.
b. Suppose you pick four cards and put each card back before you pick the next card. Your cards are KH, 7D, 6D, KH.
Which of a. or b. did you sample with replacement, and which did you sample without replacement?
Solution
a. Without replacement; b. With replacement
“AND” and “OR” Events[7]
An outcome is in the event A AND B if the outcome is in both A and B at the same time. For example, let A and B be {1, 2, 3, 4, 5} and {4, 5, 6, 7, 8}, respectively. Then A AND B = {4, 5}. This can be shown by creating a venn diagram to list all the elements of set A and the elements of set B.
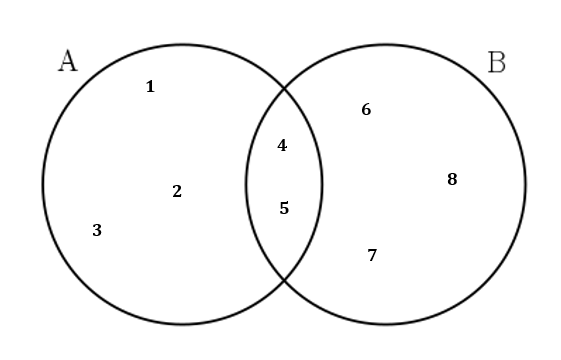 Considering both sets together, there are a total of ten elements possible. If only two of the elements are within both sets, then that means that the probability of finding a value in both set A and B,

However, when dealing with ratios as probabilities, we can represent the “AND” probability differently. Consider flipping a coin and rolling a six-sided die. You can either flip a head, or a tail on the coin, and you can roll any number between one and six on the die. These possibilities can be represented in a table of outcomes.
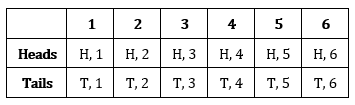 Notice that all of the possible outcomes are listed for both flipping the coin and rolling the die. This gives us total possible outcomes of 12; which will be our whole, or denominator, in our probability ratios.
If we wanted to find the probability of flipping a tail and rolling a 3, we would need to identify each situation where each of these occurrences appears in the table.
First, let’s count the number of times flipping a tail on the coin appears in the table.
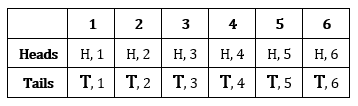

What we have essentially done above is break a whole of 12 possible outcomes into two groups of 6 known outcomes (flipping tails) which is the same as taking half of the original total outcomes. Now I am going to want to take the new group of 6 possible (all the times tails can be flipped) and take out only the times a three was rolled with the tail.
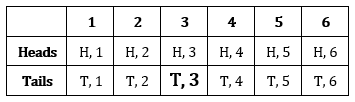

Let’s think about the probabilities we have taken so far. We started by considering half of the initial total; the twelve possibilities for flipping coins and rolling a die. We took a part of a whole. The answer we got from that was then used as the new whole for the second step. So, really, we took a fraction of a fraction, right? Here is how that looks mathematically:

What do we do when dividing fractions? We flip and multiply! So the above equations can be rewritten as multiplication as follows:

By multiplying the two separate probabilities, we calculated the same outcome as we would have gotten by simply counting the number of occurrences that include both tails AND a three in the same box. This is the general formula for calculating the probability of two independent events occurring together and can be used instead of having to draw out an outcome table every time.
![]()
“OR” Event:
An outcome is in the event A OR B if the outcome is in A or is in B or is in both A and B. For example, letA = {1, 2, 3, 4, 5} and B = {4, 5, 6, 7, 8}. A OR B = {1, 2, 3, 4, 5, 6, 7, 8}. Notice that 4 and 5 are NOT listed twice. We can look at the same Venn diagram from above again, from the OR perspective.
When looking at elements that are present in set A OR set B, that means any of the elements that qualify for either one of the two sets. This is why all the elements from both set A and set B would be in the union of A and B. This would be a probability of

When dealing with probabilities involving independent events again looks slightly different.
Using the same example from above, let’s say that this time we want either flipping a tail OR rolling a 3. We must first identify all the times that we flip a tail in the table of outcomes.
Next, we can highlight all the times a three is rolled on the die. Many students would say that there are eight different instances where one of the two possible outcomes occurred. But there is a problem. Do you see it?
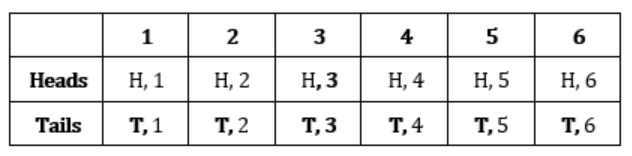 In counting the times a tail is flipped and a three is rolled separately, we have counted one of the possible occurrences twice. According to our table, there should be seven instances where a tail OR a 3 occurred, but if you’re not careful, you might accidentally count twice where they BOTH happened. In order to prevent this from happening any time we calculate the OR probability, we have to make sure that we removed the AND calculation of the two occurrences.
![]()
Conditional Probability[8]
The conditional probability of A given B is written P(A|B). P(A|B) is the probability that event A will occur given that the event B has already occurred. A conditional reduces the sample space. We calculate the probability of A from the reduced sample space B. The formula to calculate P(A|B) is  where P(B) is greater than zero.
Conditional Probability
For example, suppose we toss one fair, six-sided die. The sample space S = {1, 2, 3, 4, 5, 6}. Let A = face is 2 or 3 and B = face is even (2, 4, 6). To calculate P(A|B), we count the number of outcomes 2 or 3 in the sample space B = {2, 4, 6}. Then we divide that by the number of outcomes B (rather than S).
We get the same result by using the formula. Remember that S has six outcomes.

Key Concepts
- A ratio compares two numbers or two quantities that are measured with the same unit. The ratio of a to b is written a to b, , or a:b.
- Conversion Rules
To Convert a Fraction To Convert a Decimal To Convert a Percent To a decimal: Divide the numerator by the denominator To a fraction: Read the decimal and reduce the resulting fraction To a decimal: Move the decimal point 2 places to the left and drop the % symbol To a percent: Convert the fraction first to a decimal, then move the decimal point 2 places to the right and affix the % symbol. To a percent: Move the decimal point 2 places to the right and affix the % symbol To a fraction: Drop the % sign and write the number “over” 100. Reduce, if possible. - The definition of a probability is
Probability=number of favorable outcomestotal number of outcomes - Independent events are defined as:
- P(A|B) = P(A)
- P(B|A) = P(B)
- P(A AND B) = P(A)P(B)
- Sampling can be conducted either
- with replacement, or
- without replacement
- AND events
P(A and B) = P(A) * P(B) - OR events
P(A or B) = P(A) + P(B) – P(A and B) - Conditional Probability
- Access for free at https://openstax.org/books/introductory-statistics-2e/pages/1-introduction ; Access for free at https://openstax.org/books/prealgebra-2e/pages/1-introduction ; Access for free at https://openstax.org/books/contemporary-mathematics/pages/1-introduction ↵
- Section material derived from Openstax Prealgebra: Decimals-Ratios and Rate, and Contemporary Math: Algebra - Ratios and Proportions ↵
- Section material derived from Openstax Prealgebra: Decimals-Ratios and Rate ↵
- Section material derived from Openstax Prealgebra: Decimals-Ratios and Rate ↵
- Section material derived from Openstax Prealgebra: Decimals-Averages and Probability ↵
- Section material derived from Openstax Introductory Statistics: Probability Topics-Independent and Mutually Exclusive Events ↵
- Section material derived from Openstax Introductory Statistics: Probability Topics-Terminology ↵
- Section material derived from Openstax Introductory Statistics: Probability of Topics-Terminology ↵
A ratio compares two numbers or two quantities that are measured with the same unit. The ratio of a to b is written a to b, a/b, or a:b.
A percent is a ratio whose denominator is 100.
a subset of the set of all outcomes of an experiment; the set of all outcomes of an experiment is called a sample space and is usually denoted by S. An event is an arbitrary subset in S. It can contain one outcome, two outcomes, no outcomes (empty subset), the entire sample space, and the like. Standard notations for events are capital letters such as A, B, C, and so on.
Two events are considered independent if the knowledge that one occurred does not affect the chance the other occurs.
An outcome is in the event A AND B if the outcome is in both A AND B at the same time.
the likelihood that an event will occur given that another event has already occurred
