21 Quadratic Functions
Topics Covered
Recognize the Graph of a Quadratic Function
Previously we very briefly looked at the function  , which we called the square function. It was one of the first non-linear functions we looked at. Now we will graph functions of the form
  if
if  . We call this kind of function a quadratic function.
Quadratic Function
A quadratic function, where a, b, and c are real numbers and , is a function of the form
 .
.We graphed the quadratic function by plotting points.
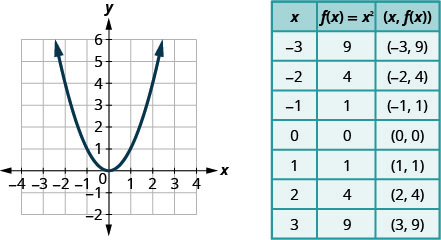
Every quadratic function has a graph that looks like this. We call this figure a parabola. Let’s practice graphing a parabola by plotting a few points.
Try it!
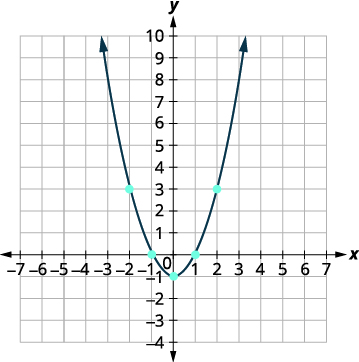
1. Graph 
Solution
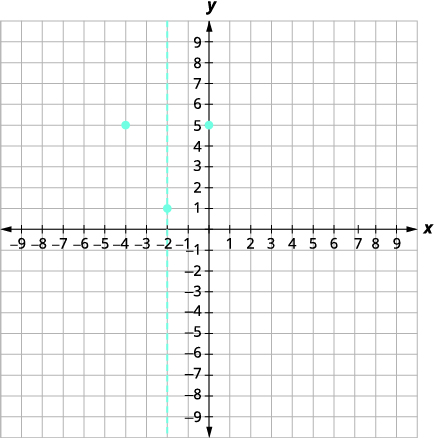
We will graph the function by plotting points.
| Steps | Translation |
| Choose integer values for x, substitute them into the equation and simplify to find  . .Record the values of the ordered pairs in the chart. |
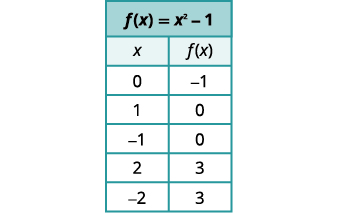 |
| Plot the points, and then connect them with a smooth curve. The result will be the graph of the function |
 |
2. Graph  .
.
Solution
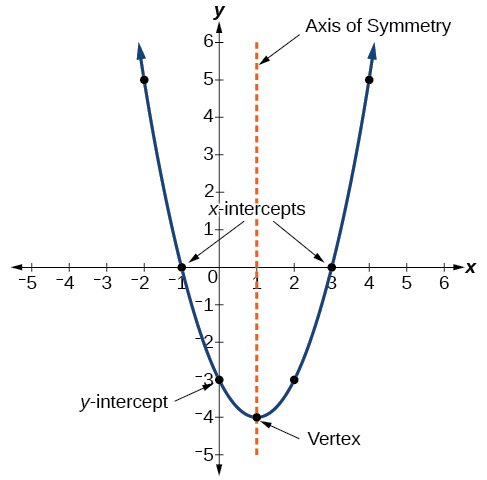
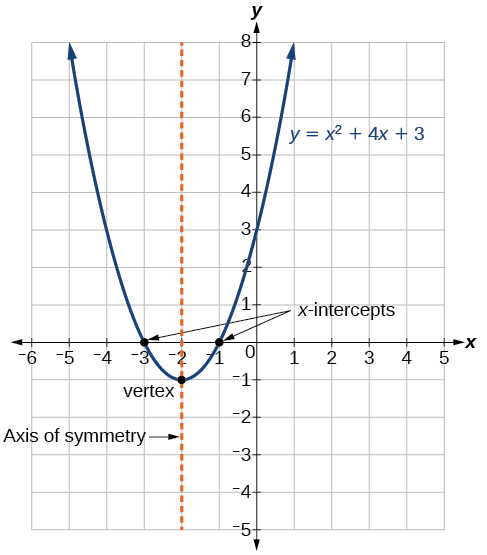
The y-intercept is the point at which the parabola crosses the y-axis. The x-intercepts are the points at which the parabola crosses the x-axis. If they exist, the x-intercepts represent the zeros, or roots of the quadratic function, the values of x at which y = 0.
Try it! – Identifying the Characteristics of a Parabola
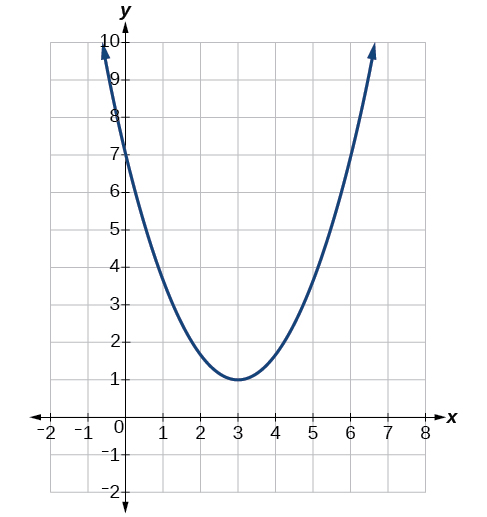
Determine the vertex, axis of symmetry, zeros, and y-intercept of the parabola shown in the graph below.
Solution
The vertex is the turning point of the graph. We can see that the vertex is at (3, 1). Because this parabola opens upward, the vertex is a minimum point. The axis of symmetry is the vertical line that intersects the parabola at the vertex. So the axis of symmetry is x = 3. This parabola does not cross the x-axis, so it has no zeros. It crosses the y-axis at (0, 7), so, this is the y-intercept.
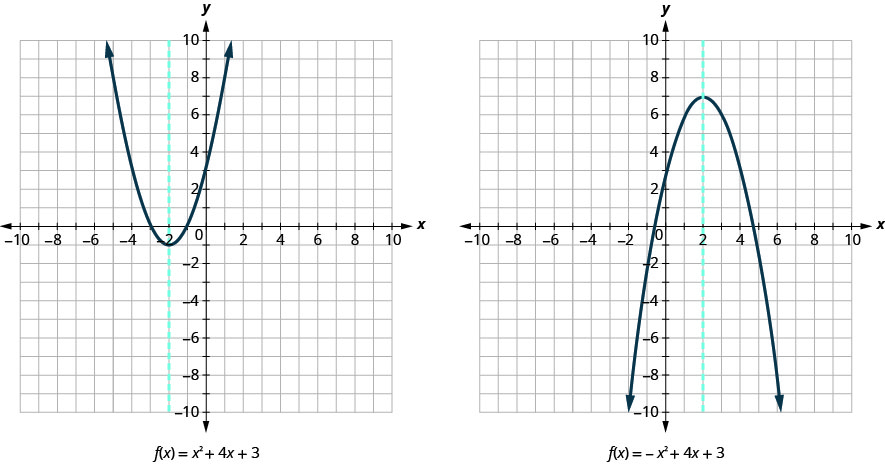
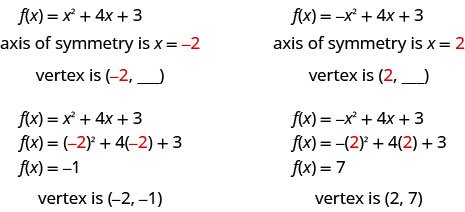
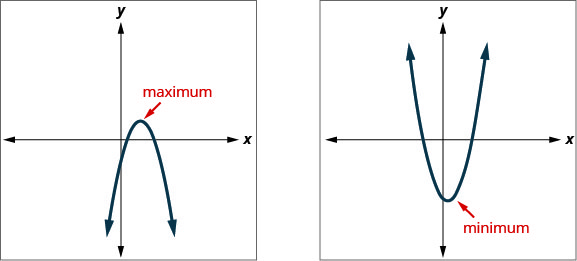
All graphs of quadratic functions of the form f(x) = ax2 + bx + c are parabolas that open upward or downward, as shown in the graph below.
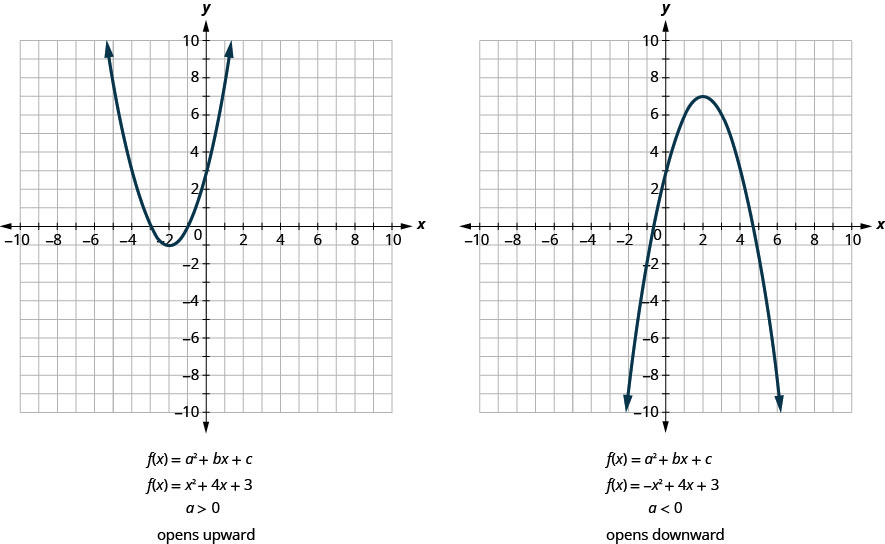
Notice that the only difference in the two functions is the negative sign before the quadratic term (x2 in the equation of the graph above). When the quadratic term is positive, the parabola opens upward, and when the quadratic term is negative, the parabola opens downward.
Parabola Orientation
For the graph of the quadratic function f (x) = ax2 + bx + c, if
Try it!
1. Determine whether each parabola opens upward or downward:
a. 
b.  .
.
Solution
a.
| Steps | Algebraic |
| Find the value of “a”. | 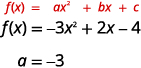 |
| Since the “a” is negative, the parabola will open downward. |
b.
| Steps | Algebraic |
| Find the value of “a”. | 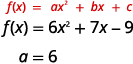 |
| Since the “a” is positive, the parabola will open upward. |
2. Determine whether the graph of each function is a parabola that opens upward or downward:
a. 
b.  .
.
Solution
a. up
b. down
Find the Axis of Symmetry and Vertex of a Parabola
The general form of a quadratic function presents the function in the form
f(x) = ax2 + bx +c
where a, b, and c are real numbers and a ≠ 0. If a > 0, the parabola opens upward. If a < 0, the parabola opens downward. We can use the general form of a parabola to find the equation for the axis of symmetry.
Look again at the previous graph. Do you see that we could fold each parabola in half and then one side would lie on top of the other? The ‘fold line’ is a line of symmetry. We call it the axis of symmetry of the parabola.
We show the same two graphs again with the axis of symmetry below.
The axis of symmetry is defined by  . If we use the quadratic formula,
  , to solve ax2 + bx + c = 0 for the x-intercepts or zeros, we find the value of x halfway between them is always
  , the equation for the axis of symmetry.
So to find the equation of symmetry of each of the parabolas we graphed above, we will substitute into the formula .
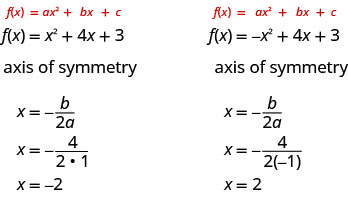 Notice that these are the equations of the dashed blue lines on the graphs.
The point on the parabola that is the lowest (parabola opens up), or the highest (parabola opens down), lies on the axis of symmetry. This point is called the vertex of the parabola.
 We can easily find the coordinates of the vertex because we know it is on the axis of symmetry. This means its x-coordinate is . To find the y-coordinate of the vertex we substitute the value of the x-coordinate into the quadratic function.
Axis of Symmetry and Vertex of a Parabola
The graph of the function f (x) = ax2 + bx + c is a parabola where:
- the axis of symmetry is the vertical line .
- the vertex is a point on the axis of symmetry, so its x-coordinate is
 .
. - the y-coordinate of the vertex is found by substituting into the quadratic equation.
How to find the vertex of the parabola, given a quadratic function in general form.
- Identify a, b, and c.
- Find h, the x-coordinate of the vertex, by substituting a and b into
 .
. - Find k, the y-coordinate of the vertex, by evaluating
 .
.
Try it!
1. For the graph of f(x) = 3x2 − 6x + 2, find:
a. the axis of symmetry
b. the vertex.
Solution
a.
| Steps | Algebraic |
| The axis of symmetry is the vertical line . |
|
| Substitute the values of a, b into the equation. | |
| Simplify. | |
| The axis of symmetry is the line x = 1. |
b.
| Steps | Algebraic |
The vertex is a point on the line of symmetry, so its x-coordinate will be  . . |
|
| Find f(1). | |
| Simplify. | |
| The result is the y-coordinate. | |
|
The vertex is (1, -1). |
2. For the graph of f(x) = 2x2 − 8x + 1, find:
a. the axis of symmetry
b. the vertex.
Solution
a. x = 2
b. (2, −7)
The standard form of a quadratic function presents the function in the form
where (h, k) is the vertex. Because the vertex appears in the standard form of the quadratic function, this form is also known as the vertex form of a quadratic function.
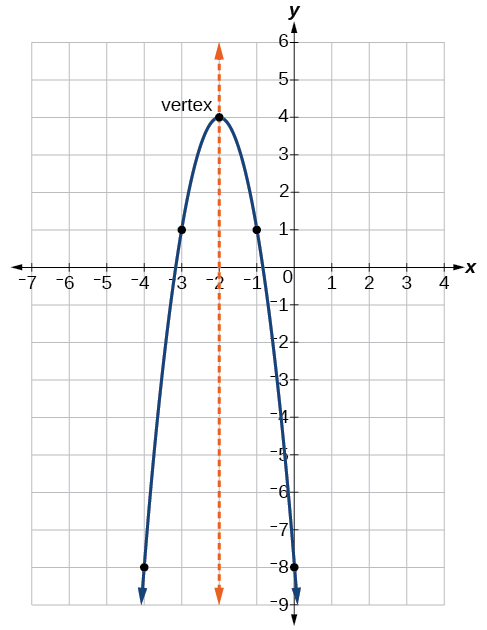
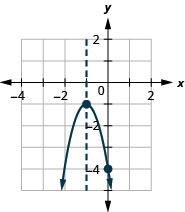
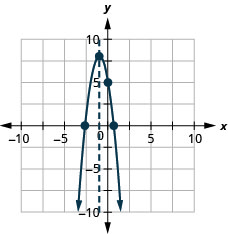
As with the general form, if a > 0, the parabola opens upward, and the vertex is a minimum. If a < 0, the parabola opens downward, and the vertex is a maximum. The graph below represents the graph of the quadratic function written in standard form as y = -3(x + 2)2 + 4. Since x – h = x + 2 in this example, h = -2. In this form, a = -3, h = -2, and k = 4. Because a < 0, the parabola opens downward. The vertex is at (−2, 4).
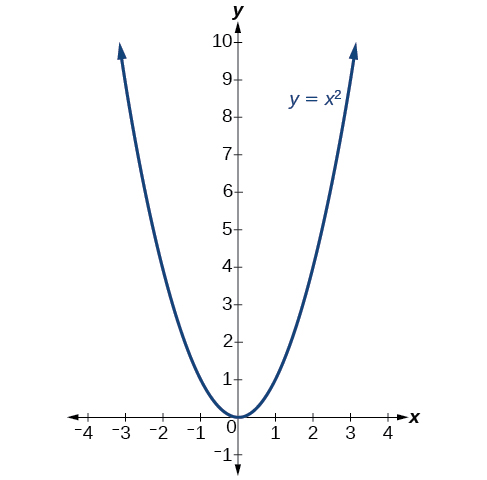
The standard form is useful for determining how the graph is transformed from the graph of y = x2. The graph shown below is that of this basic function.
The standard form and the general form are equivalent methods of describing the same function. We can see this by expanding out the general form and setting it equal to the standard form.

For the linear terms to be equal, the coefficients must be equal.

This is the axis of symmetry we defined earlier. Setting the constant terms equal:

In practice, though, it is usually easier to remember that k is the output value of the function when the input is h, so f(h) = k.
Forms of Quadratic Functions
A quadratic function is a polynomial function of degree two. The graph of a quadratic function is a parabola.
The general form of a quadratic function is f(x) = ax2 + bx + c where a, b, and c are real numbers and a ≠ 0.
The standard form of a quadratic function is f(x) = a(x − h)2 + k where a ≠ 0.
The vertex (h, k) is located at
 .
.Try it! – Finding the Vertex of a Quadratic Function
Find the vertex of the quadratic function f(x) = 2x2 – 6x + 7. Rewrite the quadratic in standard form (vertex form).
Solution
The horizontal coordinate of the vertex will be at

The vertical coordinate of the vertex will be at

Rewriting into standard form, the stretch factor will be the same as the a in the original quadratic. First, find the horizontal coordinate of the vertex. Then find the vertical coordinate of the vertex. Substitute the values into standard form, using the “a” from the general form.

The standard form of a quadratic function prior to writing the function then becomes the following:

Try it!
Given the equation g(x) = 13 + x2 − 6x, write the equation in general form and then in standard form.
Solution
g(x) = x2 − 6x + 13 in general form; g(x) = (x − 3)2 + 4 in standard form
Find the Intercepts of a Parabola
When we graphed linear equations, we often used the x– and y-intercepts to help us graph the lines. Finding the coordinates of the intercepts will help us to graph parabolas, too.
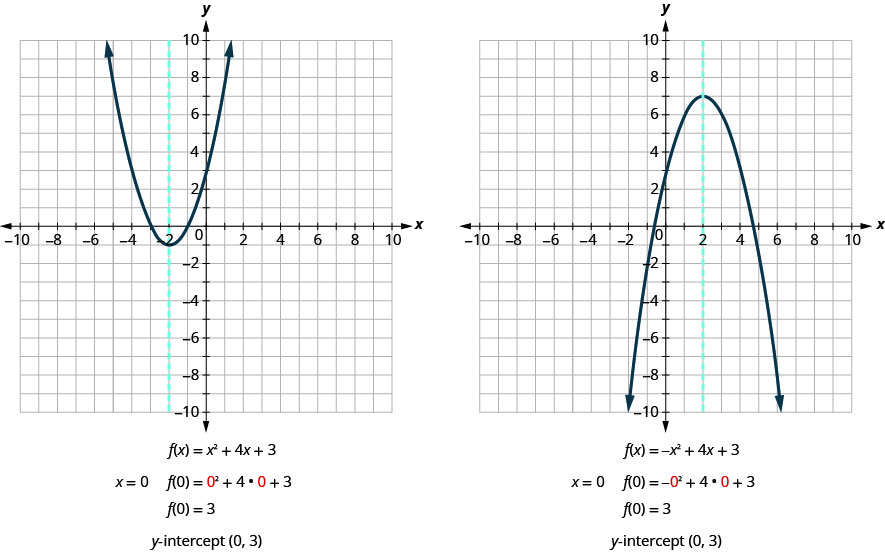
Remember, at the y-intercept the value of x is zero. So to find the y-intercept, we substitute x = 0 into the function.
Let’s find the y-intercepts of the two parabolas shown in the graph below.
An x-intercept results when the value of f(x) is zero. To find an x-intercept, we let f(x) = 0. In other words, we will need to solve the equation 0 = ax2 + bx + c for x.

Solving quadratic equations like this is exactly what we have done earlier in this chapter!
We can now find the x-intercepts of the two parabolas we looked at. First we will find the x-intercepts of the parabola whose function is f (x) = x2 + 4x + 3.
| Steps | Algebraic |
| Let f(x) = 0 | |
| Factor. | |
| Use the Zero Product Property. | |
| Solve. | |
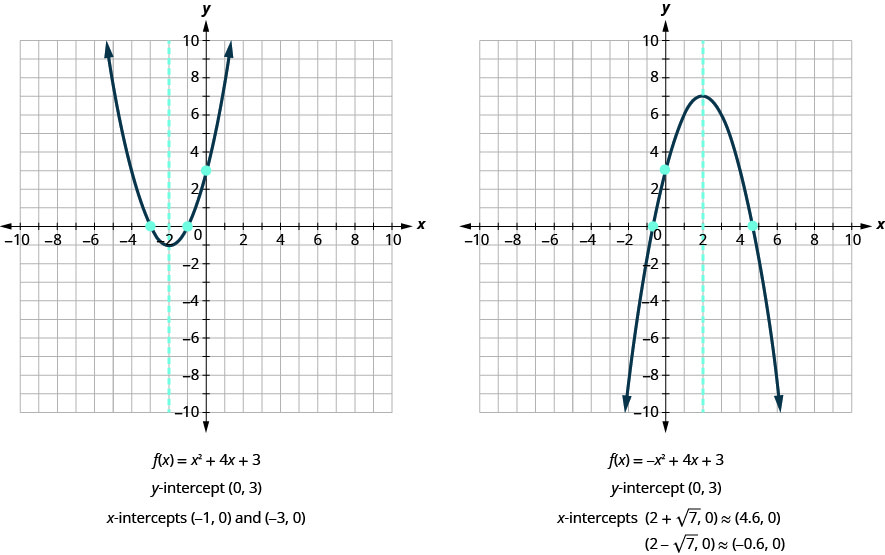
| The x-intercepts are (−1, 0) and (−3, 0). |
Now we will find the x-intercepts of the parabola whose function is f (x) = x2 + 4x + 3.
| Steps | Algebraic |
| Let f(x) = 0. | |
| This quadratic does not factor, so we use the Quadratic Formula. | |
| a = −1, b = 4, c = 3 | |
| Simplify. | |
The x-intercepts are  and and  . . |
We will use the decimal approximations of the x-intercepts so that we can locate these points on the graph,

Do these results agree with our graphs? See the graphs below.
Find the Intercepts of a Parabola
To find the intercepts of a parabola whose function is f(x) = ax2 + bx + c:
| y-intercept | x-intercepts |
| Let x = 0 and solve for f(x). | Let f(x) = 0 and solve for x. |
Try it!
1. Find the intercepts of the parabola whose function is f(x) = x2 − 2x − 8.
Solution
| Steps | Algebraic |
| To find the y–intercept, | |
| let x = 0 | |
| and solve for f(x) | |
| When x = 0, then f(0) = −8. | The y–intercept is the point (0, −8). |
| To find the x–intercept, | |
| Set equal to zero | |
| Solve by factoring. | |
| Set each factor to zero and solve | |
| Solution | |
| When f(x) = 0, then x = 4 or x = −2. | The x–intercepts are the points (4, 0) and (−2, 0). |
2. Find the intercepts of the parabola whose function is f(x) = x2 − 4x − 12.
Solution
y-intercept: (0, −12) x-intercepts (−2, 0), (6, 0)
We are now looking at quadratic functions of the form f(x) = ax2 + bx + c. The graphs of these functions are parabolas. The x–intercepts of the parabolas occur where f(x) = 0.
For example:
| Quadratic equation | Quadratic function | |
| x2 − 2x − 15 = 0 | f(x) = x2 − 2x − 15 | |
| (x − 5) (x + 3) = 0 | Let f(x) = 0. | 0 = x2 − 2x − 15 |
| x − 5 = 0 x + 3 = 0 | 0 = (x − 5) (x + 3) | |
| x = 5 x = −3 | x − 5 = 0 x + 3 = 0 | |
| x = 5 x = −3 | ||
| (5, 0) and (−3, 0) x-intercepts |
The solutions of the quadratic function are the x values of the x–intercepts.
Earlier, we saw that quadratic equations have 2, 1, or 0 solutions. The graphs below show examples of parabolas for these three cases. Since the solutions of the functions give the x–intercepts of the graphs, the number of x–intercepts is the same as the number of solutions.
Previously, we used the discriminant to determine the number of solutions of a quadratic function of the form ax2 + bx + c = 0. Now we can use the discriminant to tell us how many x-intercepts there are on the graph.
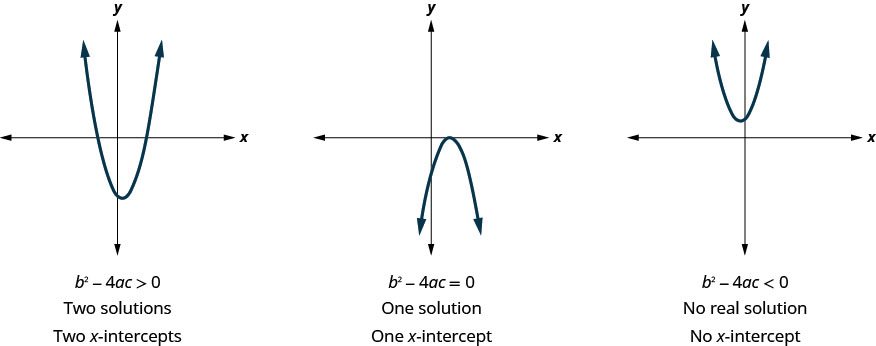
Before you find the values of the x-intercepts, you may want to evaluate the discriminant so you know how many solutions to expect.
Try it!
1. Find the intercepts of the parabola for the function f(x) = 5x2 + x + 4.
Solution
| Steps | Algebraic |
| To find the y-intercept, let x = 0 and solve for f(x). | |
| When x = 0, then f(0) = 4.
The y-intercept is the point (0, 4). |
|
| To find the x-intercept, let f(x) = 0 and solve for x. | |
| Find the value of the discriminant to predict the number of solutions which is also the number of x-intercepts. | |
|
b2 − 4ac 12 − 4 · 5 · 4 1 − 80 −79 |
|
| Since the value of the discriminant is negative, there is no real solution to the equation. There are no x-intercepts. |
2. Find the intercepts of the parabola whose function is f(x) = 3x2 + 4x + 4.
Solution
y-intercept: (0, 4) no x-intercept
Graph Quadratic Functions Using Properties
Now we have all the pieces we need in order to graph a quadratic function. We just need to put them together. In the next example we will see how to do this.
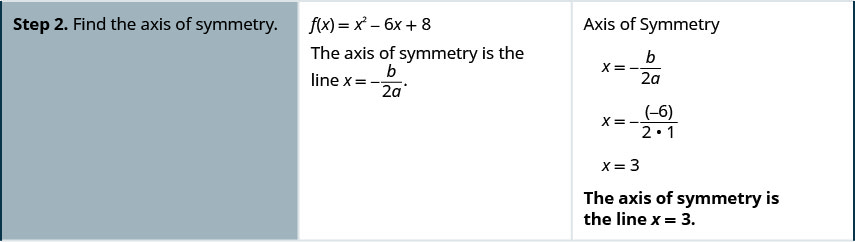
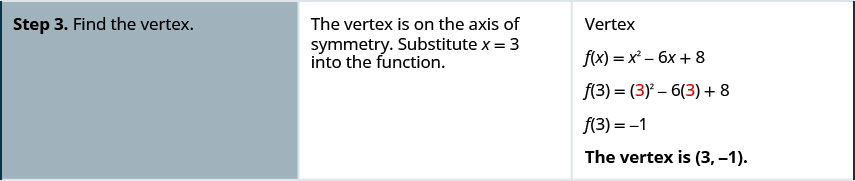
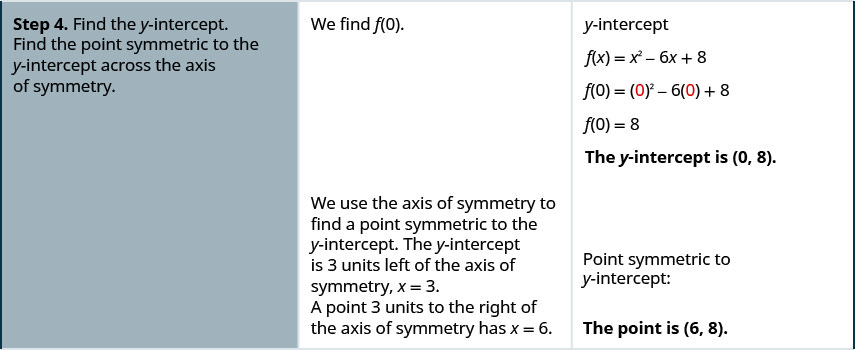
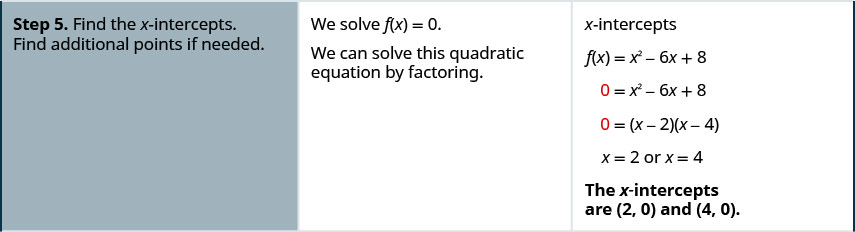
Try it! – How to Graph a Quadratic Function Using Properties
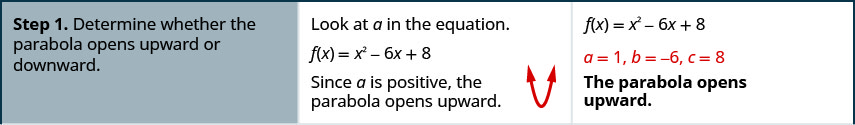
1. Graph f(x) = x2 − 6x + 8 by using its properties.
Solution
 |
 |
 |
 |
 |
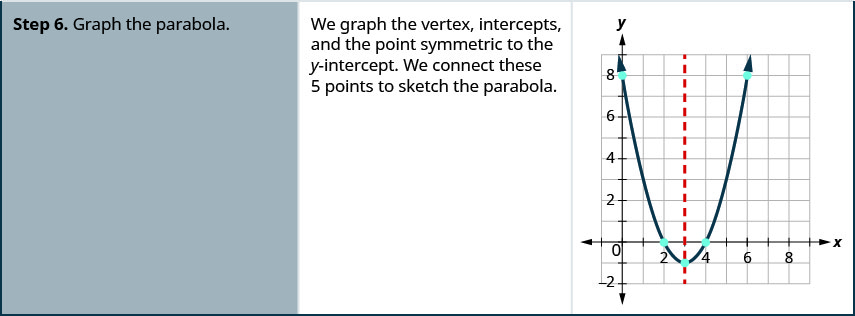 |
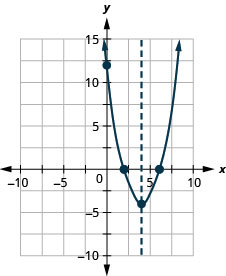
2. Graph f(x) = x2 − 8x + 12 by using its properties.
Solution
How to graph a quadratic function using properties.
- Determine whether the parabola opens upward or downward.
- Find the equation of the axis of symmetry.
- Find the vertex.
- Find the y-intercept. Find the point symmetric to the y-intercept across the axis of symmetry.
- Find the x-intercepts. Find additional points if needed.
- Graph the parabola.
We were able to find the x-intercepts in the last example by factoring. We find the x-intercepts in the next example by factoring too.
Try it!
1. Graph f(x) = x2 + 6x − 9 by using its properties.
Solution
| Steps | Algebraic |
| Since a = −1, the parabola opens downward. | |
| To find the equation of the axis of symmetry, use |
|
| The axis of symmetry is x = 3.
The vertex is on the line x = 3. |
|
 |
|
| Find f(3). | |
| The vertex is (3, 0). | |
 |
|
| The y-intercept occurs when x = 0. Find f(0). | |
| Substitute x = 0. | |
| Simplify. | |
| The y-intercept is (0,−9). | |
| The point (0, −9) is three units to the left of the line of symmetry.
The point three units to the right of the line of symmetry is (6, −9). |
 |
| Point symmetric to the y-intercept is (6, −9) | |
| The x-intercept occurs when f(x) = 0. | |
| Find f(x) = 0. | |
| Factor the GCF. | |
| Factor the trinomial. | |
| Solve for x. | |
| Connect the points to graph the parabola. | 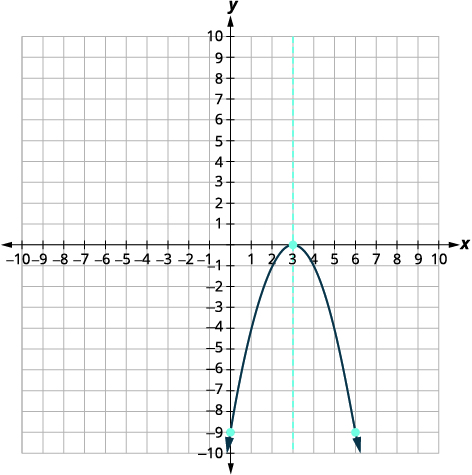 |
2. Graph f(x) = 3x2 + 12x − 12 by using its properties.
Solution:
For the graph of f(x) = −x2 + 6x − 9, the vertex and the x-intercept were the same point. Remember how the discriminant determines the number of solutions of a quadratic equation? The discriminant of the equation 0 = −x2 + 6x − 9 is 0, so there is only one solution. That means there is only one x-intercept, and it is the vertex of the parabola.
How many x-intercepts would you expect to see on the graph of f(x) = x2 + 4x + 5?
Try it!
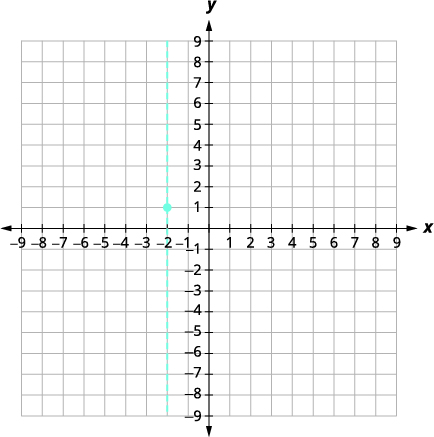
1. Graph f(x) = x2 + 4x + 5 by using its properties.
Solution
| Steps | Algebraic |
| Since a = 1, the parabola opens upward. | |
| To find the axis of symmetry, find . |
|
| The equation of the axis of symmetry is x = −2. | |
 |
|
| The vertex is on the line x = −2. | |
| Find f(x) when x = −2. | |
| The vertex is (−2, 1). | |
 |
|
| The y-intercept occurs when x = 0. | |
| Find f(0) and simplify | |
| The y-intercept is (0, 5). | |
| The point (−4, 5) is two units to the left of the line of symmetry.
The point two units to the right of the line of symmetry is (0, 5). |
 |
| Point symmetric to the y-intercept is (−4, 5). | |
| The x-intercept occurs when f(x) = 0. | 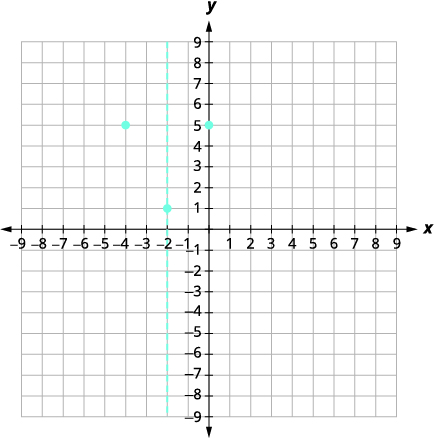 |
| Find f(x) = 0. | |
| Test the discriminant. | |
| Since the value of the discriminant is negative, there is no real solution and so no x-intercept. | |
| Connect the points to graph the parabola. You may want to choose two more points for greater accuracy. | 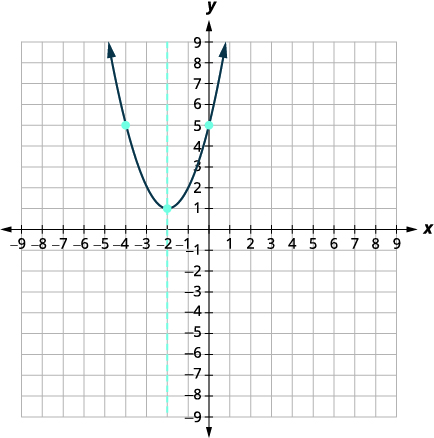 |
2. Graph f(x) = −3x2 − 6x − 4 by using its properties.
Solution
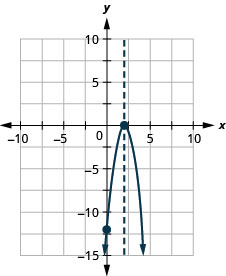
3. Graph f(x) = 2x2 − 4x − 3 by using its properties.
Solution
| Steps | Algebraic |
| Since a = 2, the parabola opens upward. | |
| To find the equation of the axis of symmetry, use |
|
| The equation of the axis of symmetry is x = 1. | |
| The vertex is on the line x = 1. | |
| Find f(1). | |
| The vertex is (1, −5). | |
| The y-intercept occurs when x = 0. | |
| Find f(0). | |
| Simplify. | |
| The y-intercept is (0, −3). | |
| The point (0, −3) is one unit to the left of the line of symmetry. | Point symmetric to the y-intercept is (2, −3). |
| The point one unit to the right of the line of symmetry is (2, −3). | |
| The x-intercept occurs when y = 0. | |
| Find f(x) = 0. | |
| Use the Quadratic Formula. | |
| Substitute in the values of a, b and c. | |
| Simplify. | |
| Simplify inside the radical. | |
| Simplify the radical. | |
| Factor the GCF. | |
| Remove common factors. | |
| Write as two equations. | |
| Approximate the values. | |
| The approximate values of the x-intercepts are (2.5, 0) and (−0.6, 0). | |
| Graph the parabola using the points found. | 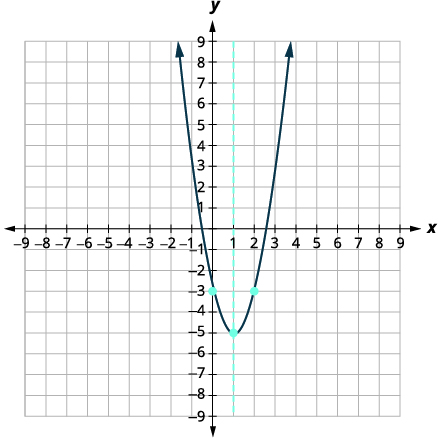 |
4. Graph f(x) = −3x2 − 6x + 5 by using its properties.
Solution
Solve Maximum and Minimum Applications
Knowing that the vertex of a parabola is the lowest or highest point of the parabola gives us an easy way to determine the minimum or maximum value of a quadratic function. The y-coordinate of the vertex is the minimum value of a parabola that opens upward. It is the maximum value of a parabola that opens downward. See the graphs below.
Minimum or Maximum Values of a Quadratic Function
The y-coordinate of the vertex of the graph of a quadratic function is the
- minimum value of the quadratic equation if the parabola opens upward.
- maximum value of the quadratic equation if the parabola opens downward.
So

is the Minimum or Maximum depending on the parabola’s orientation.
Try it!
1. Find the minimum or maximum value of the quadratic function
f(x) = x2 + 2x − 8.
Solution
| Steps | Algebraic |
| Since a is positive, the parabola opens upward. The quadratic equation has a minimum. |
|
| Find the equation of the axis of symmetry. | |
| The equation of the axis of symmetry is x = −1. | |
| The vertex is on the line x=−1. | |
| Find f(−1). | |
| The vertex is (−1, −9). | |
| Since the parabola has a minimum, the y-coordinate of the vertex is the minimum y-value of the quadratic equation.The minimum value of the quadratic is −9 and it occurs when x = −1. |
|
| Show the graph to verify the result. | 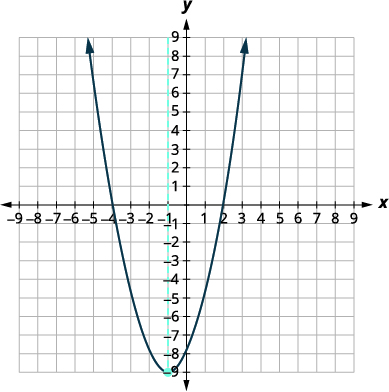 |
2. Find the maximum or minimum value of the quadratic function
f(x) = x2 − 8x + 12.
Solution
The minimum value of the quadratic function is −4 and it occurs when x = 4.
3. Find the maximum or minimum value of the quadratic function
f(x) = −4x2 + 16x − 11.
Solution
The maximum value of the quadratic function is 5 and it occurs when x = 2.
Access these online resources for additional instruction and practice with graphing quadratic functions using properties.
Key Concepts
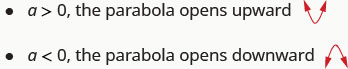
- Parabola Orientation
- For the graph of the quadratic function f(x) = ax2 + bx +c, if
- a > 0, the parabola opens upward.
- a < 0, the parabola opens downward.
- For the graph of the quadratic function f(x) = ax2 + bx +c, if
- Axis of Symmetry and Vertex of a Parabola: The graph of the function f(x) = ax2 + bx +c is a parabola where:
- the axis of symmetry is the vertical line .
- the vertex is a point on the axis of symmetry, so its x-coordinate is
 .
. - the y-coordinate of the vertex is found by substituting into the quadratic equation.
- the axis of symmetry is the vertical line
- Find the Intercepts of a Parabola
- To find the intercepts of a parabola whose function is f(x) = ax2 + bx + c:
y-intercept x-intercepts Let x = 0 and solve for f(x) Let f(x) = 0 and solve for x
- To find the intercepts of a parabola whose function is f(x) = ax2 + bx + c:
- How to graph a quadratic function using properties.
- Determine whether the parabola opens upward or downward.
- Find the equation of the axis of symmetry.
- Find the vertex.
- Find the y-intercept. Find the point symmetric to the y-intercept across the axis of symmetry.
- Find the x-intercepts. Find additional points if needed.
- Graph the parabola.
- Minimum or Maximum Values of a Quadratic Equation
- The y-coordinate of the vertex of the graph of a quadratic equation is the
- minimum value of the quadratic equation if the parabola opens upward.
- maximum value of the quadratic equation if the parabola opens downward.
A quadratic function, where a, b, and c are real numbers and a≠0,a≠0,is a function of the form f(x) = ax2 + bx + c.
