28 Logarithmic Functions
Topics Covered:
- Function and Inverse Reminders
- Convert Between Exponential and Logarithmic Forms
- Evaluate Logarithmic Functions
- Basic Log Properties
- Graphing Logarithmic Functions
- Domain of Logarithmic Functions
- Graphing Transformations of Logarithmic Functions
- Summary of Transformations of Logarithms
- Natural and Common Logarithms
- Applications with Logarithms
- Key Concepts
Function and Inverse Reminders
- Horizontal Line Test: If every horizontal line, intersects the graph of a function in at most one point, it is a one-to-one function.
- Inverse of a Function Defined by Ordered Pairs: If f(x) is a one-to-one function whose ordered pairs are of the form (x, y), then its inverse function f-1(x) is the set of ordered pairs (y, x).
- Inverse Functions: For every x in the domain of one-to-one function f and f-1,
f-1(f(x)) = x
f(f-1(x)) = x
- How to Find the Inverse of a One-to-One Function:
-
-
- Substitute y for f(x).
- Interchange the variables x and y.
- Solve for y.
- Substitute f-1(x) for y.
-
-
- The inverse function ‘undoes’ what the original function did to a value in its domain in order to get back to the original x-value. This holds for all x in the domain of f. Informally, this means that inverse functions “undo” each other. However, only one-to-one functions have inverses that are functions.
We have spent some time finding the inverse of many functions. It works well to ‘undo’ an operation with another operation. Subtracting ‘undoes’ addition, multiplication ‘undoes’ division, taking the square root ‘undoes’ squaring.
As we studied the exponential function, we saw that it is one-to-one as its graphs pass the horizontal line test. This means an exponential function does have an inverse. If we try our algebraic method for finding an inverse, we run into a problem.
| Steps | Algebraic |
| f(x) = ax | |
| Rewrite with y = f(x). | y = ax |
| Interchange the variables x and y. | x = ay |
| Solve for y. | Oops! We have no way to solve for y! |
To deal with this we define the logarithm function with base a to be the inverse of the exponential function f(x) = ax.
We use the notation f−1(x) = logax and say the inverse function of the exponential function is the logarithmic function.
The function f(x) = logax is the logarithmic function with base a, where a > 0, x > 0, and a ≠ 1.
Convert Between Exponential and Logarithmic Forms
Since the equations y = logax and x = ay are equivalent, we can go back and forth between them. This will often be the method to solve some exponential and logarithmic equations. To help with converting back and forth let’s take a close look at the equations. See the figure below. Notice the positions of the exponent and base.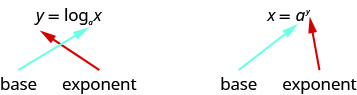 If we realize the logarithm is the exponent it makes the conversion easier. You may want to repeat, “base to the exponent give us the number.”
Can we take the logarithm of a negative number?
No. Because the base of an exponential function is always positive, no power of that base can ever be negative. We can never take the logarithm of a negative number. Also, we cannot take the logarithm of zero. Calculators may output a log of a negative number when in complex mode, but the log of a negative number is not a real number.
Try it!
- Convert to logarithmic form:
a. 23 = 8
b. 
c.  .
.
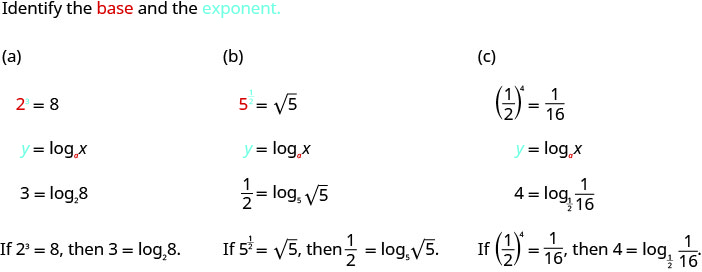
2. Convert to logarithmic form:
a. 32 = 9
b. 
c. 
Solution
a. log39 = 2
b. 
c. 
3. Convert to logarithmic form:
a. 43 = 64
b. ![\displaystyle 4^{\frac{1}{3}}=\sqrt[3]{4}](https://utsa.pressbooks.pub/app/uploads/quicklatex/quicklatex.com-55f2d64ee43de3095c157bcc804b8472_l3.png "Rendered by QuickLaTeX.com")
c. 
Solution
a. log464 = 3
b. ![\displaystyle log_{4}\sqrt[3]{4}=\frac{1}{3}](https://utsa.pressbooks.pub/app/uploads/quicklatex/quicklatex.com-68c8cac007cd6474caeb688ab9d9177f_l3.png "Rendered by QuickLaTeX.com")
c. 
In the next example we do the reverse—convert logarithmic form to exponential form.
Try it!
- Convert to exponential form:
a. 2 = log864
b. 0 = log41
c.  .
.
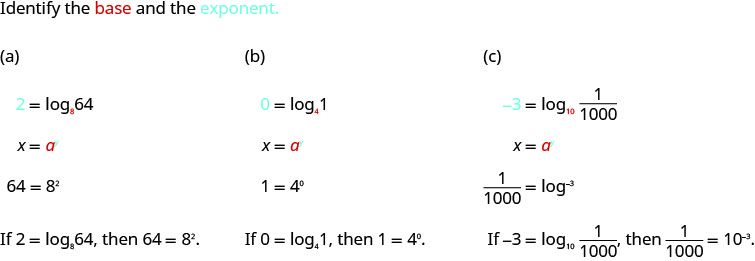
2. Convert to exponential form:
a. 3 = log464
b. 0 = logx1
c. 
Solution
a. 64 = 43
b. 1 = x0
c. 
Evaluate Logarithmic Functions
We can solve and evaluate logarithmic equations by using the technique of converting the equation to its equivalent exponential equation.
Try it!
- Find the value of x:
a. logx36 = 2
b. log4x = 3
c.  .
.
Solution
a.
| Steps | Algebraic | |
| logx36 = 2 |
||
| Convert to exponential form. | x2 = 36 |
|
| Solve the quadratic. | x = 6, | |
| The base of a logarithmic function must be positive, so we eliminate x = −6. |
x = 6 | Therefore, log636 = 2. |
b.
| Steps | Algebraic | |
| log4x = 3 |
||
| Convert to exponential form. | 43 = x |
|
| Simplify. | x = 64 | Therefore, log464 = 3. |
c.
| Steps | Algebraic | |
|
||
| Convert to exponential form. |  |
|
Rewrite  as as  . . |
 |
|
| With the same base, the exponents must be equal. | x = 3 | Therefore,  . . |
2. Find the value of x:
a. logx64 = 2
b. log5x = 3
c. 
Solution
a. x = 8
b. x = 125
c. x = 2
When see an expression such as log327, we can find its exact value in two ways. By inspection we realize it means “3 to what power will be 27”? Since 33 = 27, we know log327 = 3. An alternate way is to set the expression equal to x and then convert it into an exponential equation.
Now consider solving log749 and log327 mentally.
- We ask, “To what exponent must 7 be raised in order to get 49?” We know 72 = 49. Therefore, log749 = 2
- We ask, “To what exponent must 3 be raised in order to get 27?” We know 33 = 27. Therefore, log327 = 3
Even some seemingly more complicated logarithms can be evaluated without a calculator. For example, let’s evaluate  mentally.
- We ask, “To what exponent must
 be raised in order to get
  ?” We know 22 = 4 and 32 = 9, so
  . Therefore,
  .
.
Try it!
- Find the exact value of each logarithm without using a calculator:
a. log525
b. log93
c.  .
.
Solution
a.
| Steps | Algebraic | |
| log525 | ||
| 5 to what power will be 25? | log525 = 2 | |
| Or | ||
| Set the expression equal to x. | log525 = x | |
| Change to exponential form. | 5x = 25 | |
| Rewrite 25 as 52. | 5x = 52 | |
| With the same base the exponents must be equal. | x = 2 | Therefore, log525 = 2. |
b.
| Steps | Algebraic | |
| log93 | ||
| Set the expression equal to x. | log93 = x | |
| Change to exponential form. | 9x = 3 | |
| Rewrite 9 as 32. | (32)x = 31 | |
| Simplify the exponents. | 32x = 31 | |
| With the same base the exponents must be equal. | 2x = 1 | |
| Solve the equation. |  |
Therefore,  . . |
c.
| Steps | Algebraic | |
|
||
| Set the expression equal to x. |  |
|
| Change to exponential form. |  |
|
| Rewrite 16 as 24. |  |
|
| 2x = 2-4 | ||
| With the same base the exponents must be equal. | x = −4 | Therefore,  . . |
2. Find the exact value of each logarithm without using a calculator:
a. log12144
b. log42
c. 
Solution
a. 2
b. 
c. −5
Basic Log Properties
Now that we have learned about exponential and logarithmic functions, we can introduce some of the properties of logarithms. These will be very helpful as we continue to solve both exponential and logarithmic equations.
The first two properties derive from the definition of logarithms. Since a0 = 1, we can convert this to logarithmic form and get loga1 = 0. Also, since a1 = a, we get logaa = 1.
In the next example we could evaluate the logarithm by converting to exponential form, as we have done previously, but recognizing and then applying the properties saves time.
Try it!
- Evaluate using the properties of logarithms:
a. log81
b. log66.
Solution
a.
| Steps | Algebraic | |
| log81 | ||
| Use the property, loga1 = 0. | 0 | log81 = 0 |
b.
| Steps | Algebraic | |
| log66 | ||
| Use the property, logaa = 1. | 1 | log66 = 1 |
2. Evaluate using the properties of logarithms:
a. log131
b. log99.
Solution
a. 0
b. 1
The next two properties can also be verified by converting them from exponential form to logarithmic form, or the reverse.
The exponential equation alogax = x converts to the logarithmic equation logax = logax, which is a true statement for positive values for x only.
The logarithmic equation logaax = x converts to the exponential equation ax = ax, which is also a true statement.
These two properties are called inverse properties because, when we have the same base, raising to a power “undoes” the log and taking the log “undoes” raising to a power. These two properties show the composition of functions. Both ended up with the identity function which shows again that the exponential and logarithmic functions are inverse functions.
For a > 0, x > 0 and a ≠ 1,
In the next example, apply the inverse properties of logarithms.
Try it!
- Evaluate using the properties of logarithms:
a. 4log49
b. log335.
Solution
a.
| Steps | Algebraic | |
| 4log49 | ||
| Use the property, alogax = x. | 9 | 4log49 = 9 |
b.
| Steps | Algebraic | |
| log335 | ||
| Use the property, alogax = x. | 5 | log335 = 5 |
2. Evaluate using the properties of logarithms:
a. 5log515
b. log774
Solution
a. 15
b. 4
Graphing Logarithmic Functions
To graph a logarithmic function y = logax, it is easiest to convert the equation to its exponential form, x = ay.
Generally, when we look for ordered pairs for the graph of a function, we usually choose an x-value and then determine its corresponding y-value. In this case you may find it easier to choose y-values and then determine its corresponding x-value.
We begin with the parent function y = loga(x). Because every logarithmic function of this form is the inverse of an exponential function with the form y = ax, their graphs will be reflections of each other across the line y = x. To illustrate this, we can observe the relationship between the input and output values of y = 2x and its equivalent x = log2(y) in the table below.
| xxx | xxx | ||||||
|---|---|---|---|---|---|---|---|
| x | −3 | −2 | −1 | 0 | 1 | 2 | 3 |
| 2x = y | |
 |
|
1 | 2 | 4 | 8 |
| log2(y) = x | −3 | −2 | −1 | 0 | 1 | 2 | 3 |
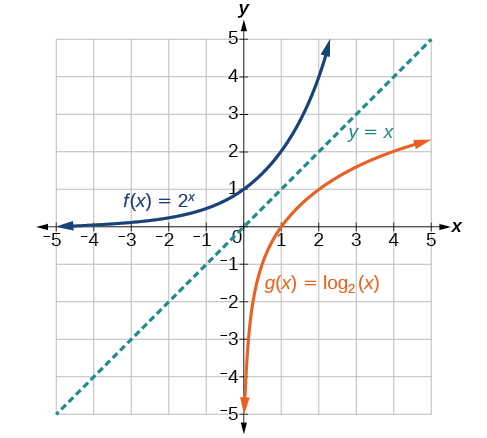
Using the inputs and outputs from the table, we can build another table to observe the relationship between points on the graphs of the inverse functions f(x) = 2x and g(x) = log2(x). See the table below.
| xxx | xxx | ||||||
|---|---|---|---|---|---|---|---|
| f(x) = 2x |  |
 |
 |
 |
 |
 |
 |
| g(x) = log2(x) |  |
 |
 |
 |
 |
 |
 |
As we’d expect, the x– and y-coordinates are reversed for the inverse functions. The figure below shows the graph of f and g.
Try it!
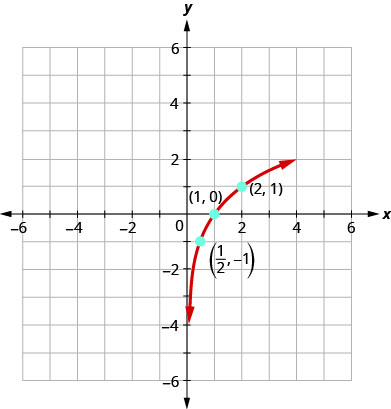
- Graph y = log2x.
Solution
To graph the function, we will first rewrite the logarithmic equation, y = log2x, in exponential form, 2y = x.
We will use point plotting to graph the function. It will be easier to start with values of y and then get x.
| y | 2y = x | (x, y) |
|---|---|---|
| −2 |  |
 |
| −1 |  |
 |
| 0 | 20 = 1 | (1, 0) |
| 1 | 21 = 2 | (2, 1) |
| 2 | 22 = 4 | (4, 2) |
| 3 | 23 = 8 | (8, 3) |
2. Graph: y = log3x.
Solution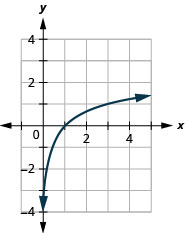
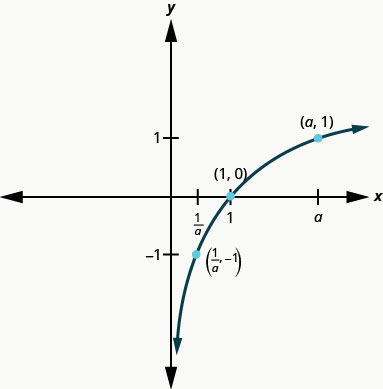
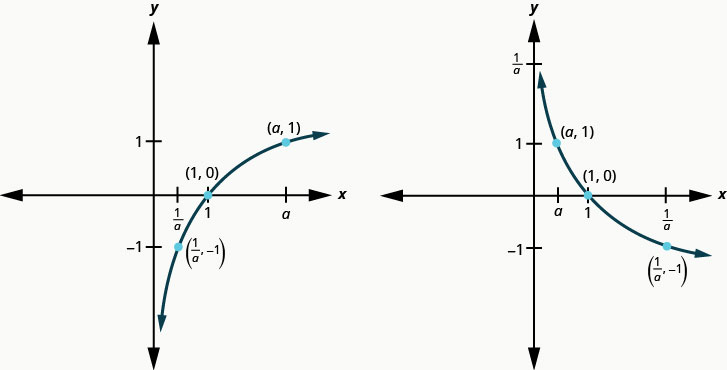
The graphs of y = log2x, and y = log3x, are the shape we expect from a logarithmic function where a > 1.
We notice that for each function the graph contains the point (1, 0). This make sense because 0 = loga1 means a0 = 1 which is true for any a.
The graph of each function, also contains the point (a, 1). This makes sense as 1 = logaa means a1 = a. which is true for any a.
Notice too, the graph of each function y = logax also contains the point  . This makes sense as
  means
means  , which is true for any a.
Look at each graph again. Now we will see that many characteristics of the logarithm function are simply ’mirror images’ of the characteristics of the corresponding exponential function.
What is the domain of the function? The graph never hits the y-axis. The domain is all positive numbers. We write the domain in interval notation as (0, ∞).
What is the range for each function? From the graphs we can see that the range is the set of all real numbers. There is no restriction on the range. We write the range in interval notation as (−∞, ∞).
When the graph approaches the y-axis so very closely but will never cross it, we call the line x = 0, the y-axis, a vertical asymptote.
Properties of the Graph of y = logax when a > 1
| Property | Answer |
| Domain | (0, ∞) |
| Range | (−∞, ∞) |
| x-intercept | (1, 0) |
| y-intercept | None |
| Contains | (a, 1), |
| Asymptote | y-axis |
Our next example looks at the graph of y = logax when 0 < a < 1.
Try it!
Graph  .
.
Solution
To graph the function, we will first rewrite the logarithmic equation, in exponential form,  .
.
We will use point plotting to graph the function. It will be easier to start with values of y and then get x.
| y | |
(x, y) |
| −2 |  |
(9, −2) |
| −1 |  |
(3, −1) |
| 0 |  |
(1, 0) |
| 1 |  |
 |
| 2 |  |
 |
| 3 |  |
 |
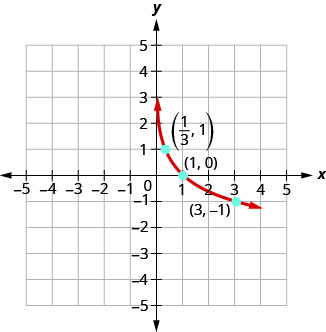
The graphs of all have the same basic shape. While this is the shape we expect from a logarithmic function where 0 < a < 1.
We notice, that for each function again, the graph contains the points, (1, 0), (a, 1), . This make sense for the same reasons we argued above.
We notice the domain and range are also the same—the domain is (0, ∞) and the range is (−∞, ∞). The y-axis is again the vertical asymptote.
Properties of the Graph of y = logax
| when a > 1 | when 0 < a < 1 | ||
|---|---|---|---|
| Domain | (0, ∞) | Domain | (0, ∞) |
| Range | (−∞, ∞) | Range | (−∞, ∞) |
| x-intercept | (1, 0) | x-intercept | (1, 0) |
| y-intercept | none | y-intercept | None |
| Contains | (a, 1),  |
Contains | (a, 1), |
| Asymptote | y-axis | Asymptote | y-axis |
| Basic shape | increasing | Basic shape | Decreasing |
We talked earlier about how the logarithmic function f-1(x) = logax is the inverse of the exponential function f(x) = ax. The graphs below show both the exponential (blue) and logarithmic (red) functions on the same graph for both a > 1 and 0 < a < 1.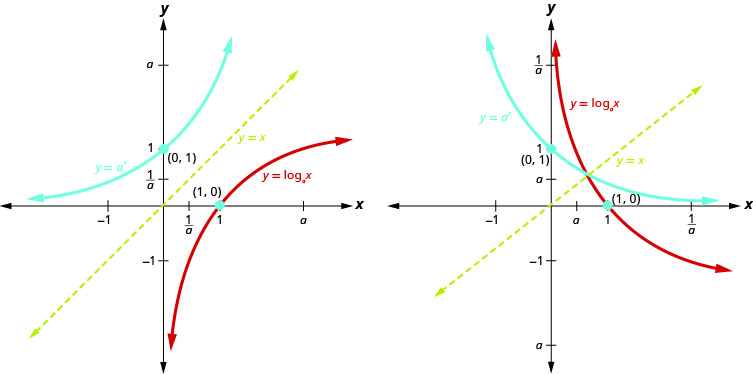 Notice how the graphs are reflections of each other through the line y = x. We know this is true of inverse functions.
Keeping a visual in your mind of these graphs will help you remember the domain and range of each function. Notice the x-axis is the horizontal asymptote for the exponential functions and the y-axis is the vertical asymptote for the logarithmic functions.
Domain of Logarithmic Functions
Recall that the exponential function is defined as y = bx for any real number x and constant b > 0, b ≠ 1, where
- The domain of y is (−∞, ∞).
- The range of y is (0, ∞).
In the last section we learned that the logarithmic function y = logb(x) is the inverse of the exponential function y = bx. So, as inverse functions:
- The domain of y = logb(x) is the range of y = bx: (0, ∞).
- The range of y = logb(x) is the domain of y = bx: (−∞, ∞).
Transformations of the parent function y = logb(x) behave similarly to those of other functions. Just as with other parent functions, we can apply the four types of transformations—shifts, stretches, compressions, and reflections—to the parent function without loss of shape.
Previously we saw that certain transformations can change the range of y = bx. Similarly, applying transformations to the parent function y = logb(x) can change the domain. When finding the domain of a logarithmic function, therefore, it is important to remember that the domain consists only of positive real numbers. That is, the argument of the logarithmic function must be greater than zero.
For example, consider f(x) = log4(2x – 3). This function is defined for any values of x such that the argument, in this case 2x − 3, is greater than zero. To find the domain, we set up an inequality and solve for x:
| Algebraic | Steps |
| 2x − 3 > 0 | Show the argument greater than zero. |
| 2x > 3 | Add 3. |
| x > 1.5 | Divide by 2. |
In interval notation, the domain of f(x) = log4(2x – 3) is (1.5, ∞).
Given a logarithmic function, identify the domain.
- Set up an inequality showing the argument greater than zero.
- Solve for x.
- Write the domain in interval notation.
Try it! – Identifying the Domain of a Logarithmic Shift
- What is the domain of f(x) = log2(x + 3)?
Solution
The logarithmic function is defined only when the input is positive, so this function is defined when x + 3 > 0. Solving this inequality,
| Algebraic | Steps |
| x + 3 > 0 | The input must be positive. |
| x > −3 | Subtract 3. |
The domain of f(x) = log2(x + 3) is (−3, ∞).
What is the domain of f(x) = log(5 − 2x)?
Solution
The logarithmic function is defined only when the input is positive, so this function is defined when 5 – 2x > 0. Solving this inequality,
| Algebraic | Steps |
| 5 − 2x > 0 | The input must be positive. |
| −2x > −5 | Subtract 5. |
 |
Divide by −2 and switch the inequality. |
The domain of f(x) = log(5 − 2x) is  .
.
Graphing Transformations of Logarithmic Functions
As we mentioned in the beginning of the section, transformations of logarithmic graphs behave similarly to those of other parent functions. We can shift, stretch, compress, and reflect the parent function y = loga(x) without loss of shape.
Graphing a Horizontal Shift of f(x) = loga(x)
When a constant c is added to the input of the parent function = f(x) = loga(x), the result is a horizontal shift c units in the opposite direction of the sign on c. To visualize horizontal shifts, we can observe the general graph of the parent function f(x) = loga(x) and for c > 0 alongside the shift left, g(x) = loga(x + c), and the shift right, h(x) = loga(x – c). See the figure below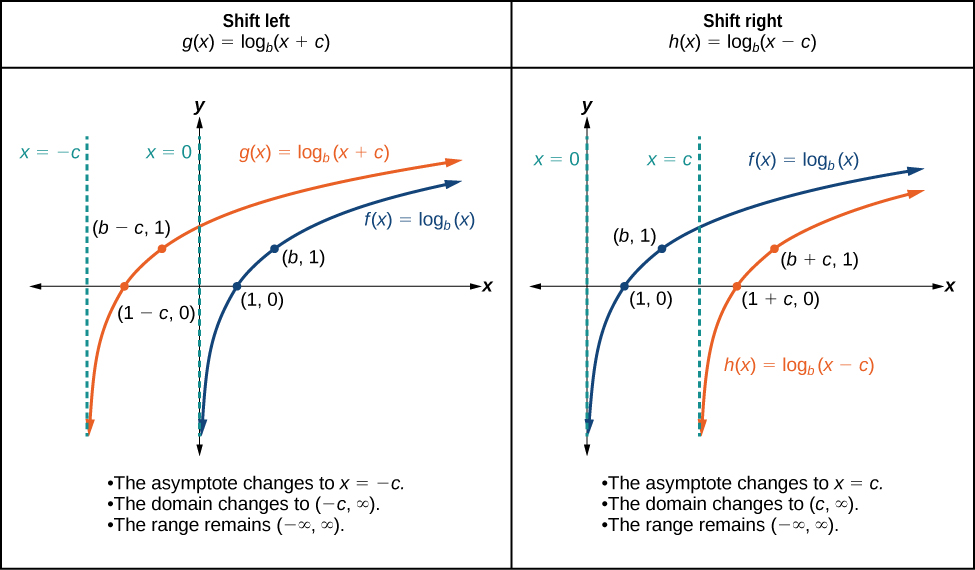
Horizontal Shifts of the Parent Function f(x) = loga(x)
For any constant c, the function f(x)= loga(x + c)
- shifts the parent function y = loga(x) left c units if c > 0.
- shifts the parent function y = loga(x) right c units if c < 0.
- has the vertical asymptote x = −c.
- has domain (−c, ∞).
- has range (−∞, ∞).
Given a logarithmic function with the form f(x) = loga(x + c), graph the translation.
- Identify the horizontal shift:
- If c > 0, shift the graph of f(x) = loga(x) left c units.
- If c < 0, shift the graph of f(x) = loga(x) right c units.
- Draw the vertical asymptote x = −c.
- Identify three key points from the parent function. Find new coordinates for the shifted functions by subtracting c from the x coordinate.
- Label the three points.
- The Domain is (−c, ∞), the range is (−∞, ∞), and the vertical asymptote is x = −c.
Try it! – Graphing a Horizontal Shift of the Parent Function y = loga(x)
Sketch the horizontal shift f(x) = log3(x − 2) alongside its parent function. Include the key points and asymptotes on the graph. State the domain, range, and asymptote.
Solution
Since the function is f(x) = log3(x − 2), we notice x + (−2) = x – 2.
Thus c = −2, so c < 0. This means we will shift the function f(x) = log3(x) right 2 units.
The vertical asymptote is x = −(−2) or x = 2.
Consider the three key points from the parent function,  , (1, 0), and (3, 1).
The new coordinates are found by adding 2 to the x coordinates.
Label the points  , (3, 0), and (5, 1).
The domain is (2 ,∞), the range is (−∞, ∞), and the vertical asymptote is x = 2.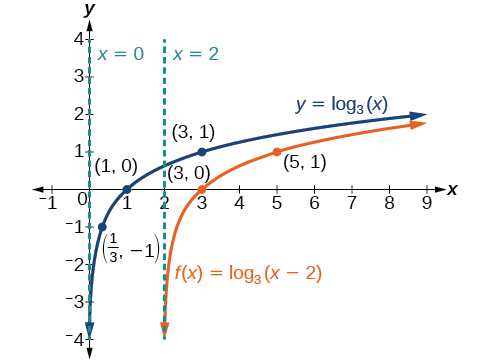
Graphing a Vertical Shift of y = loga(x)
When a constant d is added to the parent function f(x) = loga(x), the result is a vertical shift d units in the direction of the sign on d. To visualize vertical shifts, we can observe the general graph of the parent function f(x) = loga(x) alongside the shift up, g(x) = loga(x) + d, and the shift down, h(x) = loga(x) – d. See the figure below.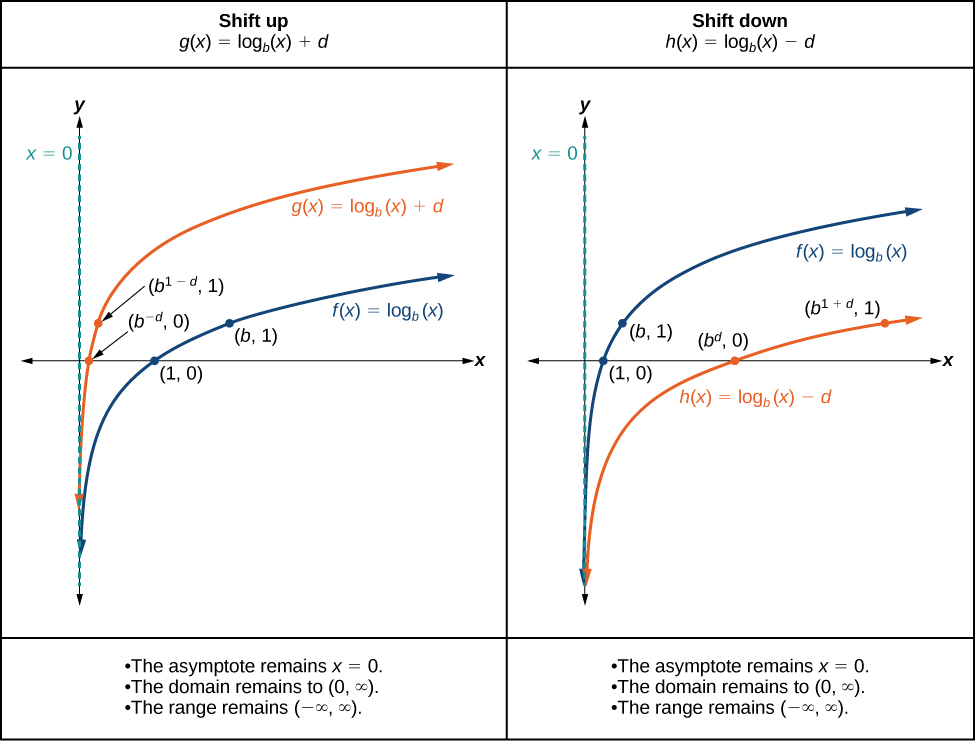
Vertical Shifts of the Parent Function y = loga(x)
For any constant d, the function f(x) = loga(x) + d
- shifts the parent function y = loga(x) up d units if d > 0.
- shifts the parent function y = loga(x) down d units if d < 0.
- has the vertical asymptote x = 0.
- has domain (0, ∞).
- has range (−∞, ∞).
Given a logarithmic function with the form f(x) = loga(x) + d, graph the translation.
- Identify the vertical shift:
- If d > 0, shift the graph of f(x) = loga(x) up d units.
- If d < 0, shift the graph of f(x) = loga(x) down d units.
- Draw the vertical asymptote x = 0.
- Identify three key points from the parent function. Find new coordinates for the shifted functions by adding d to the y coordinate.
- Label the three points.
- The domain is (0, ∞), the range is (−∞, ∞), and the vertical asymptote is x = 0.
Try it! – Graphing a Vertical Shift of the Parent Function y = loga(x)
Sketch a graph of f(x) = log3(x) − 2 alongside its parent function. Include the key points and asymptote on the graph. State the domain, range, and asymptote.
Solution
Since the function is f(x) = log3(x) − 2, we will notice d = –2. Thus d < 0.
This means we will shift the function f(x) = log3(x) down 2 units.
The vertical asymptote is x = 0.
Consider the three key points from the parent function, , (1, 0), and (3, 1).
The new coordinates are found by subtracting 2 from the y coordinates.
Label the points  , (1, -2), and (3, -1).
The domain is (0, ∞), the range is (−∞, ∞), and the vertical asymptote is x = 0.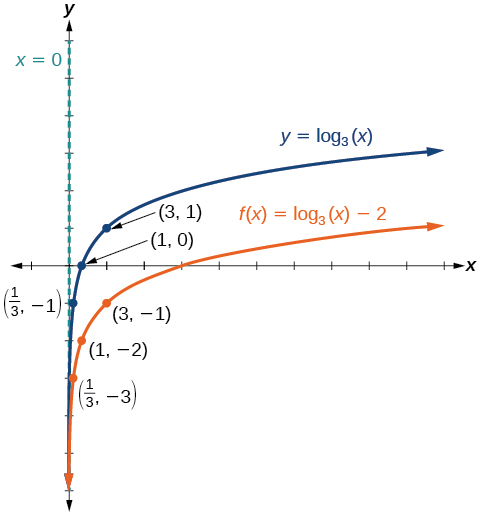
Graphing Stretches and Compressions of y = loga(x)
When the parent function f(x) = loga(x) is multiplied by a constant a > 0, the result is a vertical stretch or compression of the original graph. To visualize stretches and compressions, we set a > 1 and observe the general graph of the parent function f(x) = loga(x) alongside the vertical stretch, g(x) = aloga(x) and the vertical compression,  . See the figure below.
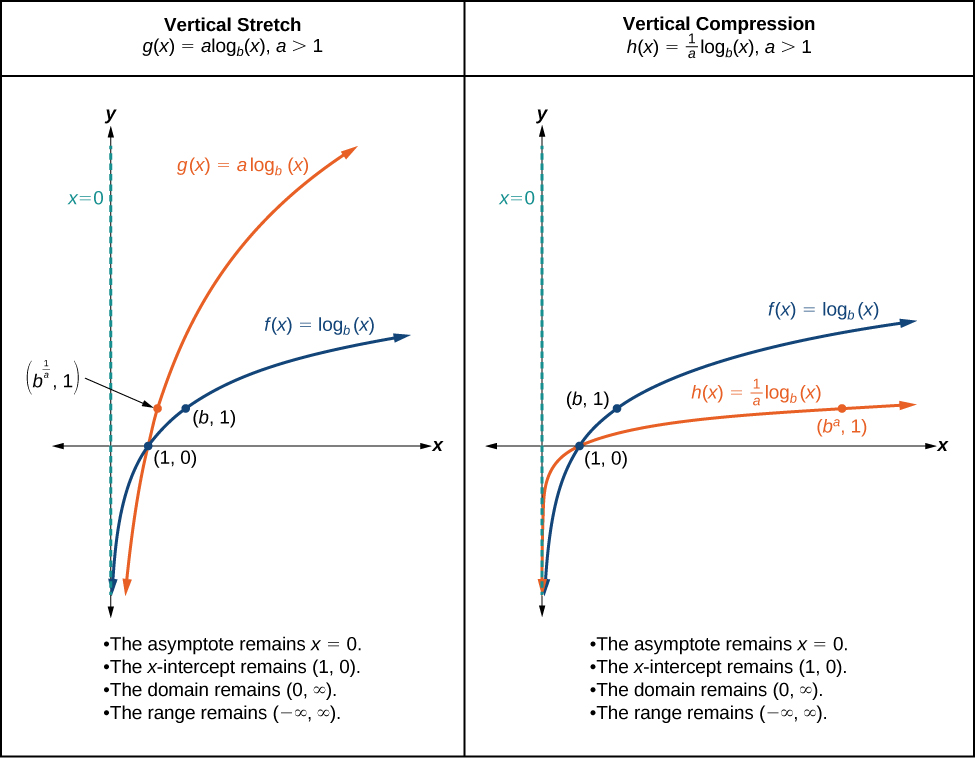 1 is the translation function with an asymptote at x=0. The graph note the intersection of the two lines at (1, 0). This shows the translation of a vertical stretch.” width=”975″ height=”758″>
Vertical Stretches and Compressions of the Parent Function y = loga(x)
For any constant a > 1, the function f(x) = aloga(x)
- stretches the parent function y = loga(x) vertically by a factor of a if a > 1.
- compresses the parent function y = loga(x) vertically by a factor of a if 0 < a < 1.
- has the vertical asymptote x = 0.
- has the x-intercept (1, 0).
- has domain (0, ∞).
- has range (−∞, ∞).
Given a logarithmic function with the form f(x) = aloga(x), a > 0, graph the translation.
- Identify the vertical stretch or compressions:
- If |a| > 1, the graph of f(x) = loga(x) is stretched by a factor of a units.
- If |a| < 1, the graph of f(x) = loga(x) is compressed by a factor of a
units.
- Draw the vertical asymptote x = 0.
- Identify three key points from the parent function. Find new coordinates for the shifted functions by multiplying the y coordinates by a.
- Label the three points.
- The domain is (0, ∞), the range is (−∞, ∞), and the vertical asymptote is x = 0.
Try it! – Graphing a Stretch or Compression of the Parent Function y = loga(x)
- Sketch a graph of f(x) = 2log4(x) alongside its parent function. Include the key points and asymptote on the graph. State the domain, range, and asymptote.
Solution
Since the function is f(x) = 2log4(x), we will notice a = 2.
This means we will stretch the function f(x) = 2log4(x) by a factor of 2.
The vertical asymptote is x = 0.
Consider the three key points from the parent function,  , (1, 0), and (4, 1).
The new coordinates are found by multiplying the y coordinates by 2.
Label the points  , (1, 0), and (4, 2).
The domain is (0, ∞), the range is (−∞, ∞), and the vertical asymptote is x = 0. See the figure below.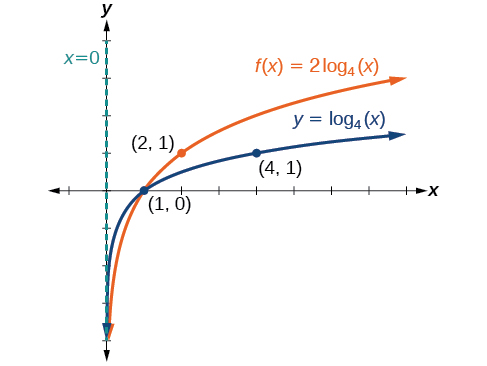
Sketch a graph of f(x) = 5log(x + 2). State the domain, range, and asymptote.
Solution
Remember: what happens inside parentheses happens first. First, we move the graph left 2 units, then stretch the function vertically by a factor of 5, as in the figure below. The vertical asymptote will be shifted to x = −2. The x-intercept will be (−1, 0).
The domain will be (−2, ∞). Two points will help give the shape of the graph: (−1, 0) and (8, 5). We chose x = 8 as the x-coordinate of one point to graph because when x = 8, x + 2 = 10, the base of the common logarithm.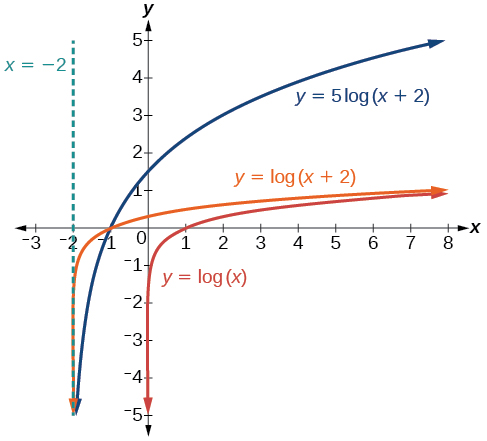 The domain is (−2, ∞), the range is (−∞, ∞), and the vertical asymptote is x = −2.
Graphing Reflections of f(x) = loga(x)
When the parent function f(x) = loga(x) is multiplied by −1,
the result is a reflection about the x-axis. When the input is multiplied by −1, the result is a reflection about the y-axis. To visualize reflections, we restrict a > 1, and observe the general graph of the parent function f(x) = loga(x) alongside the reflection about the x-axis, g(x) = -loga(x) and the reflection about the y-axis, h(x) = loga(-x).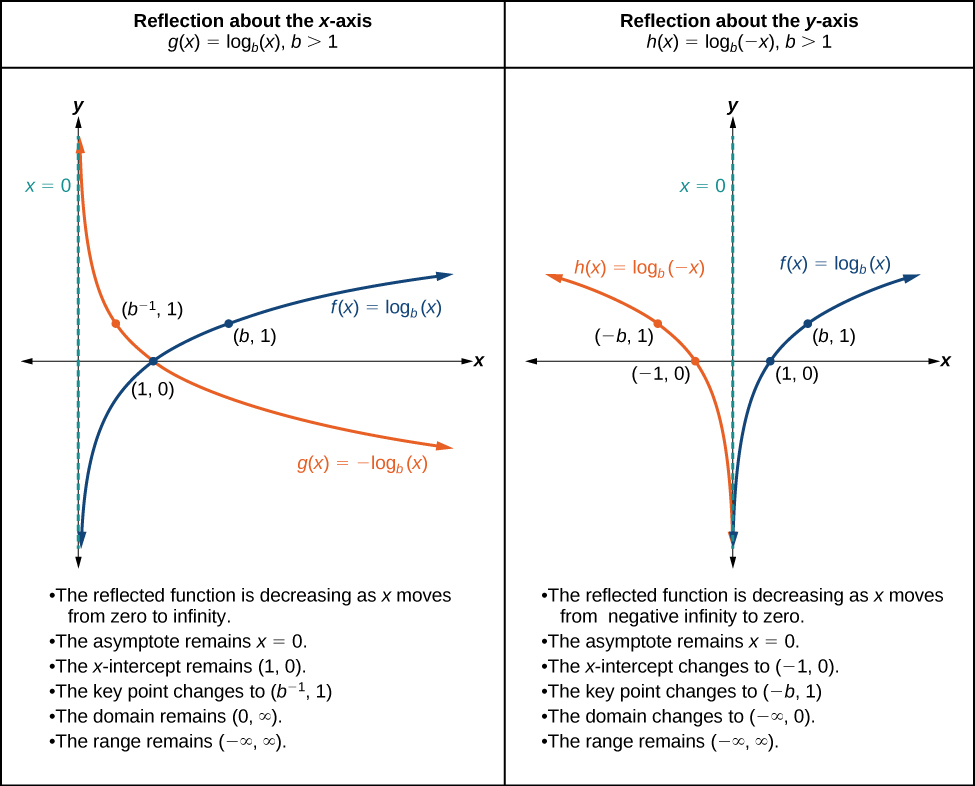 1 is the translation function with an asymptote at x=0. The graph note the intersection of the two lines at (1, 0). This shows the translation of a reflection about the x-axis.” width=”975″ height=”786″>
Reflections of the Parent Function y = loga(x)
The function f(x) = −loga(x)
- reflects the parent function y = loga(x) about the x-axis.
- has domain, (0, ∞), range, (−∞, ∞), and vertical asymptote, x = 0, which are unchanged from the parent function.
The function f(x) = loga(−x)
- reflects the parent function y = loga(x) about the y-axis.
- has domain (−∞, 0).
- has range, (−∞, ∞), and vertical asymptote, x = 0, which are unchanged from the parent function.
Given a logarithmic function with the parent function f(x) = loga(x), graph a translation.
| If f(x) = −loga(x) | If f(x) = loga(-x) |
|---|---|
|
|
|
|
|
|
|
|
|
|
Try it! -Graphing a Reflection of a Logarithmic Function
Sketch a graph of f(x) = log(−x) alongside its parent function. Include the key points and asymptote on the graph. State the domain, range, and asymptote.
Solution
Before graphing f(x) = log(−x), identify the behavior and key points for the graph.
- Since a = 10 is greater than one, we know that the parent function is increasing. Since the input value is multiplied by −1, f is a reflection of the parent graph about the y-axis. Thus, f(x) = log(−x) will be decreasing as x moves from negative infinity to zero, and the right tail of the graph will approach the vertical asymptote x = 0.
- The x-intercept is (−1, 0).
- We draw and label the asymptote, plot and label the points, and draw a smooth curve through the points.
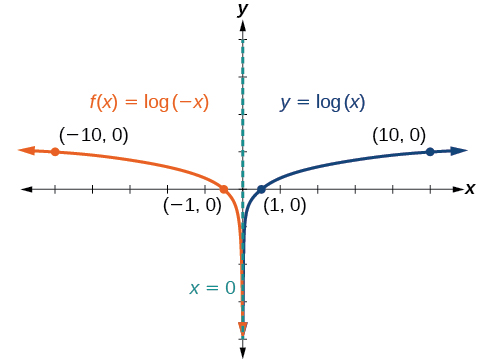
The domain is (−∞, 0), the range is (−∞, ∞), and the vertical asymptote is x = 0.
Summary of Transformations of Logarithms
Now that we have worked with each type of translation for the logarithmic function, we can summarize each in the table below to arrive at the general equation for translating exponential functions.
| Translations of the Parent Function y =loga(x) | |
|---|---|
| Translation | Form |
Shift
|
y = loga(x + c) + d |
Stretch and Compress
|
y = aloga(x) |
| Reflect about the x-axis | y = −loga(x) |
| Reflect about the y-axis | y = loga(−x) |
| General equation for all translations | y = aloga(x + c) + d |
All translations of the parent logarithmic function, y = loga(x), have the form
f(x) = aloga(x + c) + d
where the parent function, y = loga(x), a > 1, is
- shifted vertically up d units.
- shifted horizontally to the left c units.
- stretched vertically by a factor of |a| if |a| > 0.
- compressed vertically by a factor of |a| if 0 < |a| < 1.
- reflected about the x-axis when a < 0.
For f(x) = log(−x), the graph of the parent function is reflected about the y-axis.
Try it! – Finding the Vertical Asymptote of a Logarithm Graph
- What is the vertical asymptote of f(x) = −2log3(x + 4) + 5?
Solution
The vertical asymptote is at x = −4.
The coefficient, the base, and the upward translation do not affect the asymptote. The shift of the curve 4 units to the left shifts the vertical asymptote to x = −4.
2. What is the vertical asymptote of f(x) = 3 + ln(x − 1)?
Solution
x =1
Find a possible equation for the common logarithmic function graphed below.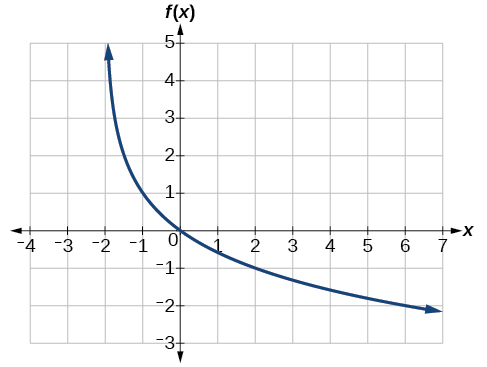
Solution
This graph has a vertical asymptote at x = –2 and has been vertically reflected. We do not know yet the vertical shift or the vertical stretch. We know so far that the equation will have form:
f(x) = −alog(x + 2) + k
It appears the graph passes through the points (–1 ,1) and (2, –1). Substituting (–1 ,1),
| Algebraic | Steps |
| 1 = -alog(-1 + 2) + k | Substitute (−1, 1). |
| 1 = -alog(1) + k | Arithmetic. |
| 1 = k | log(1) = 0. |
Next, substituting in (2, –1),
| Algebraic | Steps |
| -1 = -alog(2 + 2) + 1 | Plug in (2, −1). |
| -2 = -alog(4) | Arithmetic. |
 |
Solve for a. |
This gives us the equation  .
.
We can verify this answer by comparing the function values in the table below with the points on the given graph.
| xxx | xxx | ||||
|---|---|---|---|---|---|
| x | −1 | 0 | 1 | 2 | 3 |
| f(x) | 1 | 0 | −0.58496 | −1 | −1.3219 |
| x | 4 | 5 | 6 | 7 | 8 |
| f(x) | −1.5850 | −1.8074 | −2 | −2.1699 | −2.3219 |
4. Give the equation of the natural logarithm graphed below.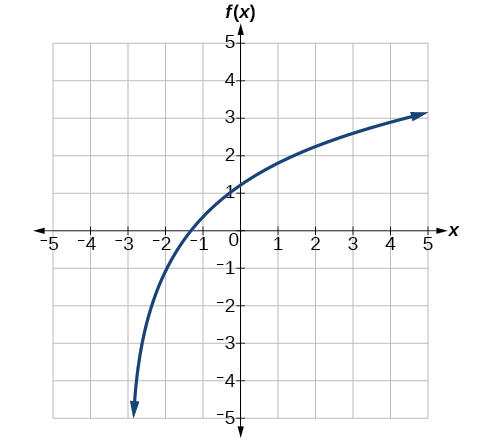
Solution
f(x) = 2ln(x + 3) − 1
Natural and Common Logarithms
When we talked about exponential functions, we introduced the number e. Just as e was a base for an exponential function, it can be used a base for logarithmic functions too. The logarithmic function with base e is called the natural logarithmic function. The function f(x) = logex is generally written f(x) = ln x and we read it as “el en of x.”
The function f(x) = ln x is the natural logarithmic function with base e, where x > 0.
y = ln x is equivalent to x = ey
We read ln(x) as, “the logarithm with base e of x” or “the natural logarithm of x.”
The logarithm y is the exponent to which e must be raised to get x.
Since the functions y = ex and y = ln(x) are inverse functions, ln(ex) = x for all x and e = x for x > 0.
Sometimes we may see a logarithm written without a base. In this case, we assume that the base is 10. In other words, the expression log(x) means log10(x). We call a base-10 logarithm a common logarithm function and the base is not shown.
The function f(x) = log x is the common logarithmic function with base 10, where x > 0.
y = log(x) is equivalent to 10y = x
We read log(x) as, “the logarithm with base 10 of x” or “log base 10 of x.”

To solve logarithmic equations, one strategy is to change the equation to exponential form and then solve the exponential equation as we did before. As we solve logarithmic equations, y = logax, we need to remember that for the base a, a > 0 and a ≠ 1. Also, the domain is x > 0. Just as with radical equations, we must check our solutions to eliminate any extraneous solutions.
Given a common logarithm of the form y = log(x), evaluate it mentally.
- Rewrite the argument x as a power of 10: 10y = x.
- Use previous knowledge of powers of 10 to identify y by asking, “To what exponent must 10 be raised in order to get x?
Try it!
- Solve: a. loga49 = 2 and b. ln x = 3.
Solution
a.
| Steps | Algebraic | |
| loga49 = 2 | ||
| Rewrite in exponential form. | a2 = 49 | |
| Solve the equation using the square root property. | a = ±7 | |
| The base cannot be negative, so we eliminate a = −7. | a = 7, | |
| Check. | ||
| a = 7 | loga49 = 2 | |
 |
||
 |
||
| 49 = 49✓ | ||
b.
| Steps | Algebraic | |
| ln x = 3 | ||
| Rewrite in exponential form. | e3 = x | |
| Check. | ||
| x = e3 | ln x = 3 | |
 |
||
| e3 = e3 ✓ | ||
2. Solve:
a. loga121 = 2
b. ln x = 7
Solution
a. a = 11
b. x = e7
3. Solve:
a. loga64 = 3
b. ln x = 9
Solution
a. a = 4
b. x = e9
4. Solve:
a. log2(3x − 5) = 4
b. ln e2x = 4.
Solution
a.
| Steps | Algebraic |
| log2(3x − 5) = 4 | |
| Rewrite in exponential form. | 24 = 3x − 5 |
| Simplify. | 16 = 3x − 5 |
| Solve the equation. | 21 = 3x |
| 7 = x | |
| Check. | |
| x = 7 | log2(3x − 5) = 4 |
 |
|
 |
|
 |
|
| 16 = 16 ✓ | |
b.
| Steps | Algebraic |
| ln e2x = 4 | |
| Rewrite in exponential form. | e4 = e2x |
| Since the bases are the same the exponents are equal. | 4 = 2x |
| Solve the equation. | 2 = x |
| Check. | |
| x = 2 | ln e2x = 4 |
 |
|
 |
|
| e4 = e4 ✓ | |
5. Solve:
a. log2(5x − 1) = 6
b. ln e3x = 6
Solution
a. x = 13
b. x = 2
6. Solve:
a. log3(4x + 3) = 3
b. ln e4x = 4
Solution
a. x = 6
b. x = 1
Applications with Logarithms
There are many applications that are modeled by logarithmic equations. We will first look at the logarithmic equation that gives the decibel (dB) level of sound. Decibels range from 0, which is barely audible to 160, which can rupture an eardrum.
The 10-12 in the formula represents the intensity of sound that is barely audible.
The loudness level, D, measured in decibels, of a sound of intensity, I, measured in watts per square inch is

Try it!
- Extended exposure to noise that measures 85 dB can cause permanent damage to the inner ear which will result in hearing loss. What is the decibel level of music coming through earphones with intensity 10-2 watts per square inch?
Solution
| Steps | Algebraic |
| Substitute in the intensity level, I. | |
| Simplify. | |
| Since log 1010 = 10. | |
| Multiply. | |
| The decibel level of music coming through earphones is 100 dB. |
2. What is the decibel level of one of the new quiet dishwashers with intensity 10-7 watts per square inch?
Solution
The quiet dishwashers have a decibel level of 50 dB.
The magnitude R of an earthquake is measured by R = log I, where I is the intensity of its shock wave.
Try it!
In 1906, San Francisco experienced an intense earthquake with a magnitude of 7.8 on the Richter scale. Over 80% of the city was destroyed by the resulting fires. In 2014, Los Angeles experienced a moderate earthquake that measured 5.1 on the Richter scale and caused $108 million dollars of damage. Compare the intensities of the two earthquakes.
Solution
To compare the intensities, we first need to convert the magnitudes to intensities using the log formula. Then we will set up a ratio to compare the intensities.
| Steps | Algebraic |
| Convert the magnitudes to intensities. | R = log I |
| 1906 earthquake | 7.8 = log I |
| Convert to exponential form. | I = 107.8 |
| 2014 earthquake | 5.1 = log I |
| Convert to exponential form. | I = 105.1 |
| Form a ratio of the intensities. |  |
| Substitute in the values. |  |
| Divide by subtracting the exponents. | 102.7 |
| Evaluate. | 501 |
| The intensity of the 1906 earthquakewas about 501 times the intensity of the 2014 earthquake. | |
Access these online resources for additional instruction and practice with evaluating and graphing logarithmic functions.
Access these online resources for additional instruction and practice with graphing logarithms.
Key Concepts
- Properties of the Graph of y = logax:
when a > 1 when 0 < a < 1 Domain (0, ∞) Domain (0, ∞) Range (−∞, ∞) Range (−∞, ∞) x-intercept (1, 0) x-intercept (1, 0) y-intercept none y-intercept none Contains (a, 1), Contains (a, 1), Asymptote y-axis Asymptote y-axis Basic shape increasing Basic shape decreasing 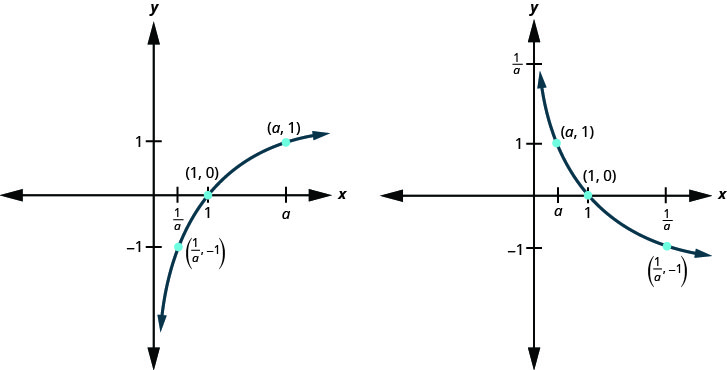
- Decibel Level of Sound: The loudness level,
D, measured in decibels, of a sound of intensity, I, measured in watts per square inch is .
. - Earthquake Intensity: The magnitude
R of an earthquake is measured by R = log I, where I is the intensity of its shock wave.
| Term | Definition |
| Definition of the logarithmic function | For x > 0, b > 0, b ≠ 1,
y = logb(x) if and only if by = x. |
| Definition of the common logarithm | For x > 0, y = log(x) if and only if 10y = x. |
| Definition of the natural logarithm | For x > 0, y = ln(x) if and only if ey = x. |
The function f(x) = log base a (x) is the logarithmic function with base a, where a > 0, x > 0, and a ≠ 1.
y = log (base)a x is equivalent to x = a^y
The function f(x) = log (base e) x is generally written f(x) = ln x and we read it as “el en of x.”
The function f(x)=log(x) is the common logarithmic function with base10, where x>0. y=log(x) is equivalent to x=10^y
