6 Slope Basics
Topics Covered
Defining Slope
When you graph linear equations, you may notice that some lines tilt up as they go from left to right and some lines tilt down. Some lines are very steep and some lines are flatter.
In mathematics, the measure of the steepness of a line is called the slope of the line.
The concept of slope has many applications in the real world. In construction the pitch of a roof, the slant of the plumbing pipes, and the steepness of the stairs are all applications of slope. and as you ski or jog down a hill, you definitely experience slope.
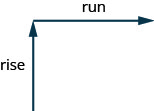
We can assign a numerical value to the slope of a line by finding the ratio of the rise and run. The rise is the amount the vertical distance changes while the run measures the horizontal change, as shown in this illustration. Slope is a rate of change.
Slope of a Line
The slope of a line is m =  .
.
The rise measures the vertical change and the run measures the horizontal change.
- Locate two points on the line whose coordinates are integers.
- Starting with one point, sketch a right triangle, going from the first point to the second point.
- Count the rise and the run on the legs of the triangle.
- Take the ratio of rise to run to find the slope: m = .
To find the slope of a line, we locate two points on the line whose coordinates are integers. Then we sketch a right triangle where the two points are vertices and one side is horizontal and one side is vertical.
Try It!
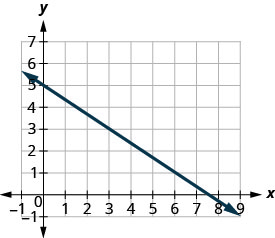
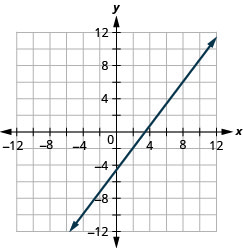
Find the slope of the line shown.
Solution:
| Steps | Algebraic |
| Locate two points on the graph whose coordinates are integers. |
(0,5) and (3,3) |
| Starting at (0,5), sketch a right triangle to (3,3) as shown in this graph. | 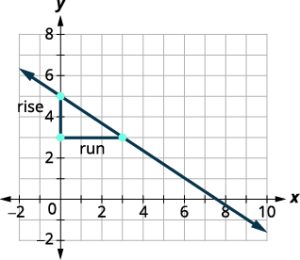 |
| Count the rise— since it goes down, it is negative. | The rise is −2. |
| Count the run. | The run is 3. |
| Use the slope formula. | m = . |
| Substitute the values of the rise and run. | m=  |
| Simplify. | m= –  |
| The slope of the line is – . |
|
| So y decreases by 2 units as x increases by 3 units. |
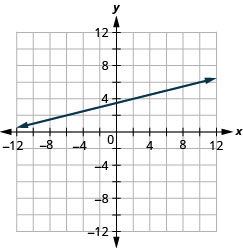
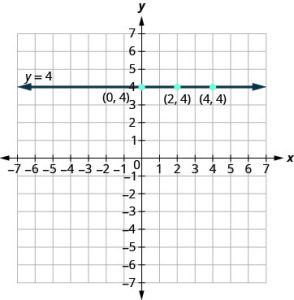
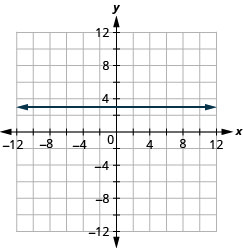
How do we find the slope of horizontal and vertical lines? To find the slope of the horizontal line, y = 4, we could graph the line, find two points on it, and count the rise and the run. Let’s see what happens when we do this, as shown in the graph below.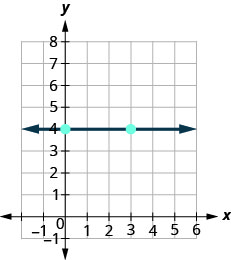 What is the rise? The rise is 0.
What is the run? The run is 3.
What is the slope? m = =  , m = 0
The slope of the horizontal line y = 4 is 0.
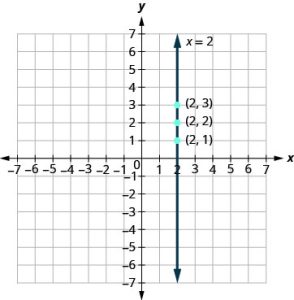
Let’s also consider a vertical line, the line x = 3, as shown in the graph.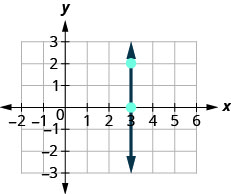 What is the rise? The rise is 2.
What is the run? The run is 0.
What is the slope? m = =  ,
,
The slope is undefined since division by zero is undefined. So we say that the slope of the vertical line x = 3 is undefined.
All horizontal lines have slope 0. When the y-coordinates are the same, the rise is 0.
The slope of any vertical line is undefined. When the x-coordinates of a line are all the same, the run is 0.
The slope of a horizontal line, y = b, is 0.
The slope of a vertical line, x = a, is undefined.
Try it!
Find the slope of each line: a. x = 8 b. y = −5.
Solution:
a. x = 8 This is a vertical line. Its slope is undefined.
b. y = −5 This is a horizontal line. It has slope 0.
Quick Guide to the Slopes of Lines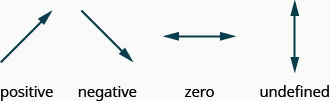
We will use (x1, y1) to identify the first point and (x2, y2) to identify the second point.
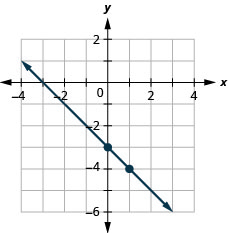
Let’s see how the rise and run relate to the coordinates of the two points by taking another look at the slope of the line between the points (2, 3) and (7, 6), as shown in this graph.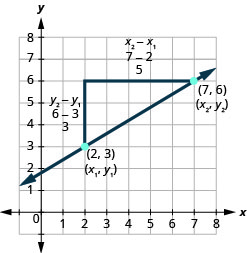
| Steps | Algebraic |
| Since we have two points, we will use subscript notation. | 
m = |
| On the graph, we counted the rise of 3 and the run of 5 | m =  |
| Notice that the rise of 3 can be found by subtracting they-coordinates, 6 and 3, and the run of 5 can be found by subtracting the x-coordinates 7 and 2. | |
| We rewrite the rise and run by putting in the coordinates. | m =  |
| But 6 is y2, the y-coordinate of the second point and 3 is y1, the y-coordinate of the first point. So we can rewrite the slope using subscript notation. | m =  |
| Also 7 is the x-coordinate of the second point and 2 is the x-coordinate of the first point. So again we rewrite the slope using subscript notation. | m =  |
The slope of the line between two points (x1,y1) and (x2,y2) is:
Try it!
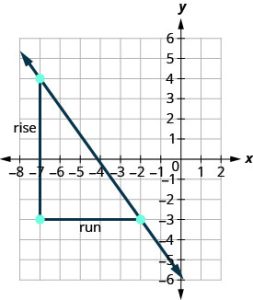
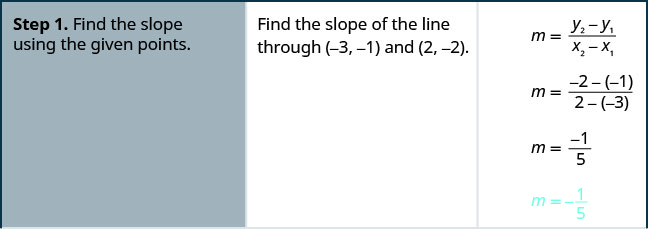
Use the slope formula to find the slope of the line through the points (−2, −3) and (−7, 4).
Solution:
| Steps | Algebraic |
| We’ll call (−2, −3) point #1 and (−7, 4) point #2. |  |
| Use the slope formula. | m = |
| Substitute the values. y of the second point minus y of the first point |
|
| x of the second point minus x of the first point | m =  |
| Simplify. | m =  |
m = – |
Let’s verify this slope on the graph shown.
 m =
m =
m =
m = –
Try it! – Finding the Slope of a Line Given Two Points
Find the slope of a line that passes through the points (2, −1) and (−5, 3).
Solution:
We substitute the y-values and the x-values into the formula.


The slope is –
It does not matter which point is called (x1,y1) or (x2,y2). As long as we are consistent with the order of the y terms and the order of the x terms in the numerator and denominator, the calculation will yield the same result.
Slope and Equations
Now that we’ve defined slope, and looked at the Standard form of a line( Ax+By=C ), there are two other forms of a linear equation in addition to the Standard form:
| Point Slope Form | Slope Intercept Form |
| y − y1 = m(x − x1) | y = mx + b |
| where m=slope (x1,y1) is a point on the line. | where m = slope and b = y-intercept. |
What if all you are given is 2 points of a line? We know from the previous section that you could use them to determine slope, but the this process will also allow us to find out what the linear equation would look like.
Slope also indicates the direction in which a line slants as well as its steepness. Slope is sometimes described as rise over run.
Suppose we have a line that has slope m and that contains some specific point (x1, y1) and some other point, which we will just call (x, y). We can write the slope of this line and then change it to a different form.
Point-Slope Form
Given one point and the slope, the point-slope formula will lead to the equation of a line:
What happens if you only have two points? Can we find the slope with just two points? Yes, using the steps we looked at in the previous section. Once we have the slope, we can use it and one of the given points to find the equation. The following example gives two points, so you need to solve for slope first and then use one of the points.
- Find the slope using the given points. m =
- Choose one point.
- Substitute the values into the point-slope form: y − y1 = m (x − x1)
- Write the equation in slope-intercept form.
Try it!
Find the equation of the line passing through the points (3, 4) and (0, −3). Write the final equation in slope-intercept form.
Solution:
First, we calculate the slope using the slope formula and two points.


Next, we use the point-slope formula with the slope of , and either point. Let’s pick the point (3,4) for (x1,y1).

 – 7 – 3
The equation is written as y = – 3. (this is known as Slope-intercept form).
Analysis
To prove that either point can be used, let us use the second point (0,−3) and see if we get the same equation.
 – 3
– 3We see that the same line will be obtained using either point. This makes sense because we used both points to calculate the slope.
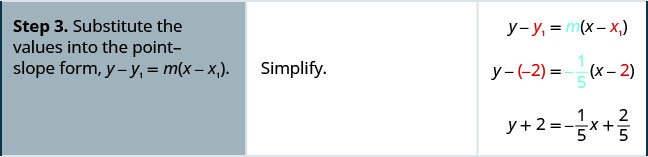
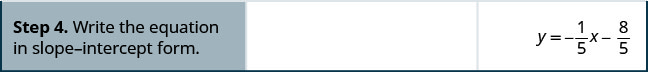
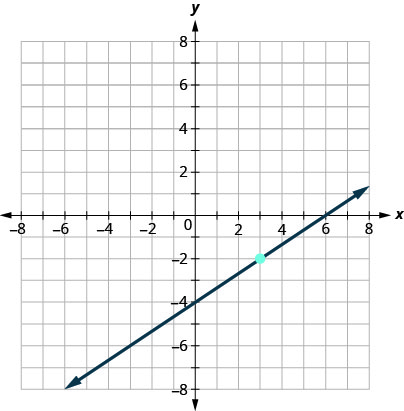
Find an equation of a line that contains the points (−3, 5) and (−3, 4). Write the equation in slope-intercept form.
Solution:
Again, the first step will be to find the slope.
| Steps | Algebraic |
m =  |
|
| Multiply both sides of the equation by x − x1. | m(x – x1) =  |
| Simplify. | m(x – x1) = y – y1 |
| Rewrite the equation with the y terms on the left. | y – y1 = m(x – x1) |
| Question | Algebraic |
| Find the slope of the line through (−3, 5) and (−3, 4). | m = |
m =  |
|
m =  |
|
| The Slope is undefined. |
This tells us it is a vertical line. Both of our points have an x-coordinate of −2. So our equation of the line is x = −2. Since there is no y, we cannot write it in slope-intercept form.
You may want to sketch a graph using the two given points. Does your graph agree with our conclusion that this is a vertical line?
Try it! – How to Find the Equation of a Line Given Two Points
Find an equation of a line that contains the points (−3,−1) and (2,−2) Write the equation in slope-intercept form.
Solution:

In the examples above you will note the form of the equation we get after using point-slope form is: y = mx + b. where m = slope and b = y-intercept. Practice identifying them below.
Try it! – Identifying the Slope and y-intercept of a Line Given an Equation
Identify the slope and y-intercept, given the equation y = – – 4
– 4
Solution:
As the line is in y = mx + b form, the given line has a slope of m = – . The y-intercept is b = −4.
Analysis:
The y-intercept is the point at which the line crosses the y-axis. On the y-axis, x = 0. We can always identify the y-intercept when the line is in slope-intercept form, as it will always equal b. Or, just substitute x=0 and solve for y.
We can easily determine the slope and intercept of a line if the equation is written in slope-intercept form, y=mx+b. Now we will do the reverse—we will start with the slope and y-intercept and use them to find the equation of the line.
- Identify the slope.
- Identify the point.
- Substitute the values into the point-slope form, y − y1 = m(x − x1).
- Write the equation in slope-intercept form.
Try it! – Finding the Equation of a Line Given the Slope and One Point
Write the equation of the line with slope m = −3 and passing through the point (4, 8). Then solve the equation for y.
Solution:
Using the point-slope formula, substitute −3 for m and the point (4, 8) for (x1, y1).
Note that any point on the line can be used to find the equation. If done correctly, the same final equation will be obtained.
#2 Find the equation of a line with slope m = – and containing the point (10, −5).
Solution:
y = – – 1
#3 Find the equation of the line shown in the graph.
Solution:
We need to find the slope and y-intercept of the line from the graph so we can substitute the needed values into the slope-intercept form, y = mx + b
To find the slope, we choose two points on the graph.
The y-intercept is (0, −4) and the graph passes through (3, −2).
| Steps | Algebraic |
| Find the slope, by counting the rise and run. | |
| Find the y-intercept. | |
| Substitute the values into y = mx + b | |
#4 Find an equation of a horizontal line that contains the point (−2, −6). Write the equation in slope-intercept form.
Solution:
Every horizontal line has slope 0. We can substitute the slope and points into the point-slope form, y − y1 = m(x − x1).
| Steps | Algebraic |
| Identify the slope. | |
| Identify the point. | |
| Substitute the values into
y−y1=m(x−x1) |
|
| Simplify. | |
| Write in slope-intercept form. | It is in y-form, but could be written y=0x−6. |
Did we end up with the form of a horizontal line, y = a?
Graphing and Slope
We can also graph a line when we know one point and the slope of the line. We will start by plotting the point and then use the definition of slope to draw the graph of the line.
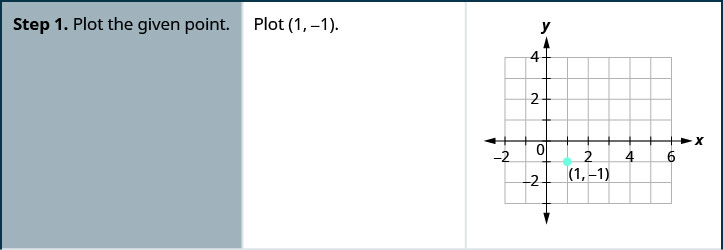
Try it! – How to graph a Line Given a Point and the Slope
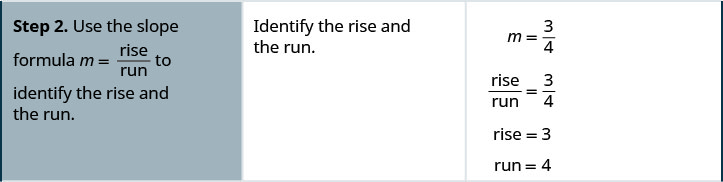
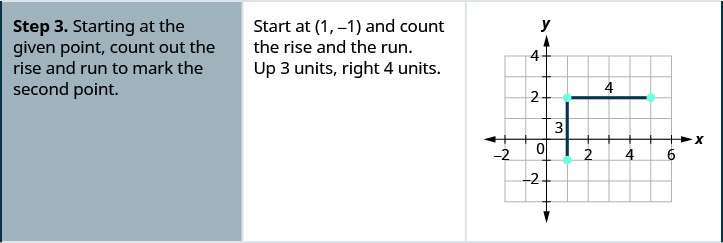
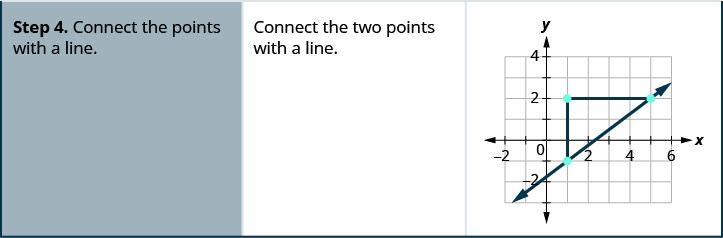
Graph the line passing through the point (1, −1) whose slope is m = .
You can check your work by finding a third point. Since the slope is m = it can also be written as m =  (negative divided by negative is positive!). Go back to (1, −1) and count out the rise, −3, and the run, −4.
Graph the line passing through the point (2, −2) with the slope m = 
Solution:
Graph the line passing through the point (−2, 3) with the slope m = 
Solution:
- Plot the given point.
- Use the slope formula m = to identify the rise and the run.
- Starting at the given point, count out the rise and run to mark the second point.
- Connect the points with a line.
Graphing with Slope and Intercept
We have graphed linear equations by plotting points, using intercepts, recognizing horizontal and vertical lines, and using one point and the slope of the line. Once we see how an equation in slope–intercept form and its graph are related, we’ll have one more method we can use to graph lines.
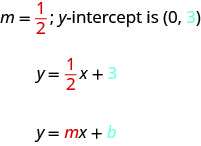
See [link]. Let’s look at the graph of the equation y =  + 3 and find its slope and y-intercept.
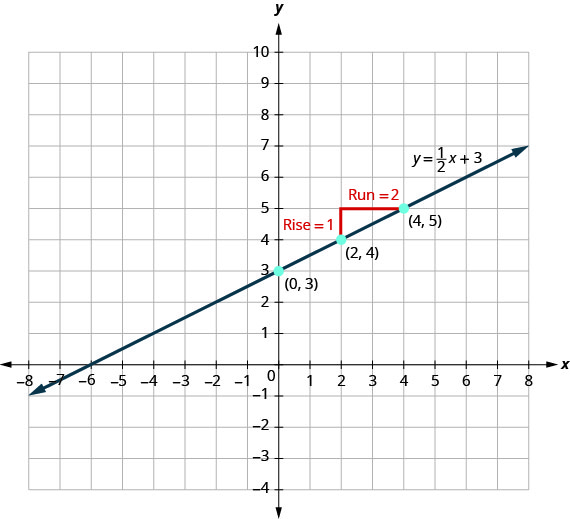
The red lines in the graph show us the rise is 1 and the run is 2. Substituting into the slope formula:

The y-intercept is (0, 3).
Look at the equation of this line.
![]()
Look at the slope and y-intercept.
![]()
When a linear equation is solved for y, the coefficient of the x term is the slope and the constant term is the y-coordinate of the y-intercept. We say that the equation y = + 3 is in slope–intercept form. Sometimes the slope–intercept form is called the “y-form.”
Let’s practice finding the values of the slope and y-intercept from the equation of a line.
Try It!
Identify the slope and y-intercept of the line from the equation:
a. y = − − 2 b. x + 3y = 9
Solution:
a. We compare our equation to the slope–intercept form of the equation.
| Steps | Algebraic |
| Write the slope–intercept form of the equation of the line. | |
| Write the equation of the line. | |
| Identify the slope. | |
| Identify the y-intercept. |
b. When an equation of a line is not given in slope–intercept form, our first step will be to solve the equation for y.
| Steps | Algebraic |
| Solve for y. | x + 3y = 9 |
| Subtract x from each side. | |
| Divide both sides by 3. | |
| Simplify. | |
| Write the slope–intercept form of the equation of the line. | |
| Write the equation of the line. | |
| Identify the slope. | |
| Identify the y-intercept. |
Identify the slope and y-intercept from the equation of the line.
a. y = − + 1 b. 3x + 2y = 12
Solution:
a. m = −; (0, 1)
b. m = − ; (0, 6)
We have graphed a line using the slope and a point. Now that we know how to find the slope and y-intercept of a line from its equation, we can use the y-intercept as the point, and then count out the slope from there.
Graph the line of the equation y = −x + 4 using its slope and y-intercept.
Solution:
| Steps | Algebraic |
| y = mx + b | |
| The equation is in slope–intercept form. | y = −x + 4 |
| Identify the slope and y-intercept. | m = −1 y-intercept is (0, 4) |
| Plot the y-intercept. | See the graph. |
| Identify the rise over the run. | m =  |
| Count out the rise and run to mark the second point. Draw the line as shown in the graph. | rise −1, run 1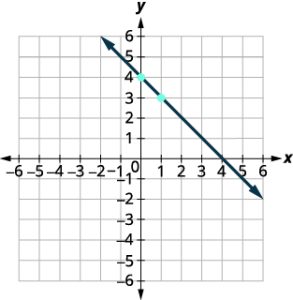 |
Graph the line of the equation y = −x − 3 using its slope and y-intercept.
Solution:
Vertical and Horizontal Lines
Some linear equations have only one variable. They may have just x and no y, or just y without an x. This changes how we make a table of values to get the points to plot.
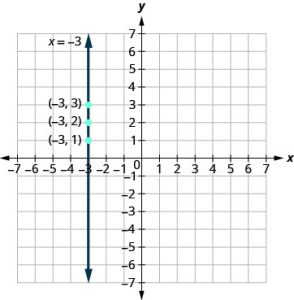
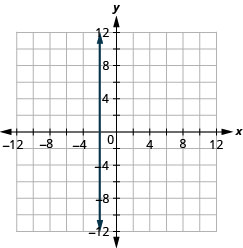
Let’s consider the equation x = −3. This equation has only one variable, x. The equation says that x is always equal to −3, so its value does not depend on y. No matter what is the value of y, the value of x is always −3.
So to make a table of values, write −3 in for all the x-values. Then choose any values for y. Since x does not depend on y, you can choose any numbers you like. But to fit the points on our coordinate graph, we’ll use 1, 2, and 3 for the y-coordinates. See [link].
|
x = −3 |
||
| x | y | (x, y) |
| −3 | 1 | (−3, 1) |
| −3 | 2 | (−3, 2) |
| −3 | 3 | (−3, 3) |
Plot the points from the table and connect them with a straight line. Notice that we have graphed a vertical line.
What if the equation has y but no x? Let’s graph the equation y=4. This time the y-value is a constant, so in this equation, y does not depend on x. Fill in 4 for all the y’s in [link] and then choose any values for x. We’ll use 0, 2, and 4 for the x-coordinates.
|
y = 4 |
||
| x | y | (x, y) |
| 0 | 4 | (0, 4) |
| 2 | 4 | (2, 4) |
| 4 | 4 | (4, 4) |
In this figure, we have graphed a horizontal line passing through the y-axis at 4.
A vertical line is the graph of an equation of the form x = a. The line passes through the x-axis at (a, 0).
A horizontal line is the graph of an equation of the form y = b. The line passes through the y-axis at (0, b).
Try it!
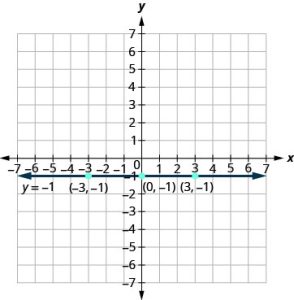
Graph: a. x = 2 b. y = −1.
Solution:
a. The equation has only one variable, x, and x is always equal to 2. We create a table where x is always 2 and then put in any values for y. The graph is a vertical line passing through the x-axis at 2.
|
x = 2 |
||
| x | y | (x, y) |
| 2 | 1 | (2, 1) |
| 2 | 2 | (2, 2) |
| 2 | 3 | (2, 3) |
b. Similarly, the equation y = −1 has only one variable, y. The value of y is constant. All the ordered pairs in the next table have the same y-coordinate. The graph is a horizontal line passing through the y-axis at −1.
|
y = −1 |
||
| x | y | (x, y) |
| 0 | −1 | (0, −1) |
| 3 | −1 | (3, −1) |
| −3 | −1 | (−3, −1) |
Graph the equations: a. x = −2 b. y = 3.
Solution:
a.
b.
What is the difference between the equations y = 4x and y = 4?
The equation y = 4x has both x and y. The value of y depends on the value of x, so the y -coordinate changes according to the value of x. The equation y = 4 has only one variable. The value of y is constant, it does not depend on the value of x, so the y-coordinate is always 4.
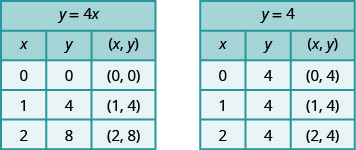
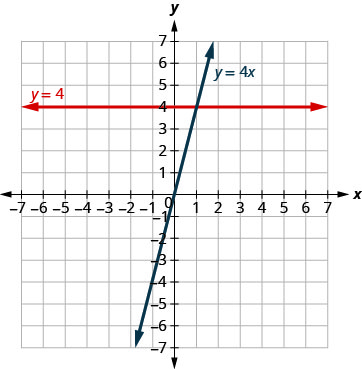 Notice, in the graph, the equation y = 4x gives a slanted line, while y = 4 gives a horizontal line.
Try it!
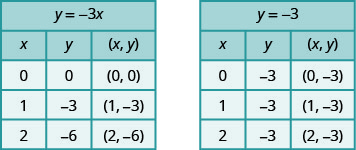
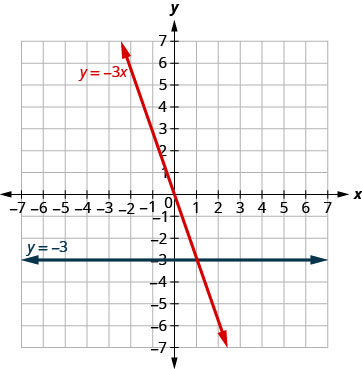
Graph y = −3x and y = −3 in the same rectangular coordinate system.
Solution:
We notice that the first equation has the variable x, while the second does not. We make a table of points for each equation and then graph the lines. The two graphs are shown.
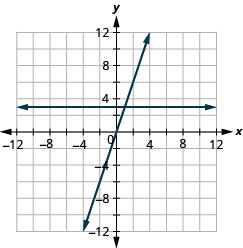
Graph the equations in the same rectangular coordinate system: y = 3 and y = 3x.
Solution:
Key Concepts
- Slope of a Line
- The slope of a line is m = .
- The rise measures the vertical change and the run measures the horizontal change.
- The slope of a line is m =
- How to find the slope of a line from its graph using m = .
- Locate two points on the line whose coordinates are integers.
- Starting with one point, sketch a right triangle, going from the first point to the second point.
- Count the rise and the run on the legs of the triangle.
- Take the ratio of rise to run to find the slope: m = .
- Slope of a line between two points.
- The slope of the line between two points (x1, y1) and (x2, y2) is:
m =
- The slope of the line between two points (x1, y1) and (x2, y2) is:
- How to graph a line given a point and the slope.
- Plot the given point.
- Use the slope formula m = to identify the rise and the run.
- Starting at the given point, count out the rise and run to mark the second point.
- Connect the points with a line.
- Slope Intercept Form of an Equation of a Line
- The slope–intercept form of an equation of a line with slope m and y-intercept, (0, b) is y = mx + b

We have seen that we can use either the slope-intercept form or the point-slope form to find an equation of a line. Which form we use will depend on the information we are given.
To Write an Equation of a Line If given: Use: Form: Slope and y-intercept slope-intercept y = mx + b Slope and a point point-slope y − y1 = m(x − x1) Two points point-slope y − y1 = m(x − x1) - The slope–intercept form of an equation of a line with slope m and y-intercept, (0, b) is y = mx + b
The point-slope form of an equation of a line with slope m and containing the point (x1,y1) is y − y1 = m(x − x1).
