14 More on Functions
Topics Covered
Identify Graphs of Basic (Toolkit) Functions
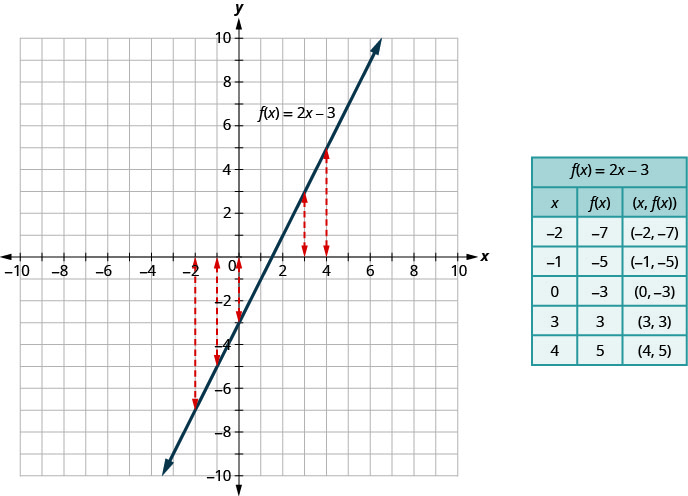
We can write y = 2x − 3 as in function notation as f(x) = 2x − 3. It still means the same thing. The graph of the function is the graph of all ordered pairs (x, y) where y = f(x). So we can write the ordered pairs as (x, f(x)). It looks different but the graph will be the same.
Graph of a Function
The graph of a function is the graph of all its ordered pairs, (x, y) or using function notation, (x, f(x)) where y = f(x).
| Notation | description |
| f | name of function |
| x | x-coordinate of the ordered pair |
| f(x) | y-coordinate of the ordered pair |
As we move forward in our study, it is helpful to be familiar with the graphs of several basic functions and be able to identify them.
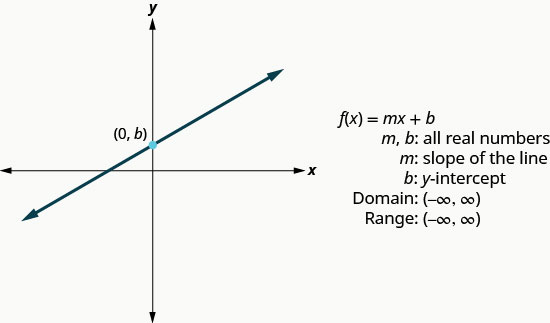
We wrote linear equations in several forms, but it will be most helpful for us here to use the slope-intercept form of the linear equation. The slope-intercept form of a linear equation is y = mx + b. In function notation, this linear function becomes f(x) = mx + b where m is the slope of the line and b is the y-intercept. The domain is the set of all real numbers, and the range is also the set of all real numbers.
Linear Function
Try it!
Graph: f(x) = −2x − 4.
Solution:
| Steps | Algebraic |
| f(x) = −2x − 4 | |
| We recognize this as a linear function. | |
| Find the slope and y-intercept. | m = −2, b = −4 |
| Graph using the slope intercept. | 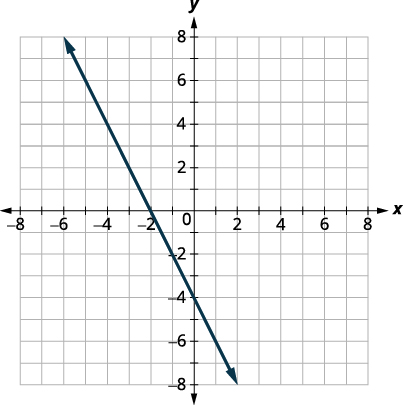 |
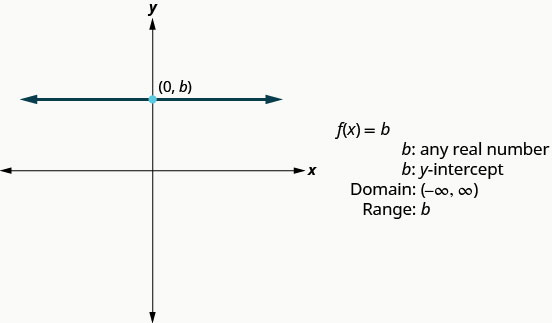
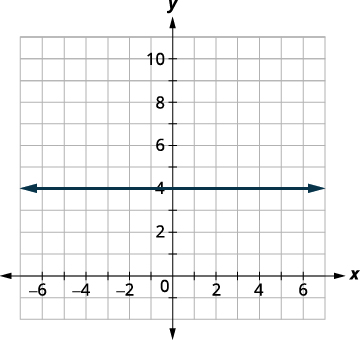
The next function whose graph we will look at is called the constant function and its equation is of the form f(x) = b, where b is any real number. If we replace the f(x) with y, we get y = b. We recognize this as the horizontal line whose y-intercept is b. The graph of the function f(x) = b, is also the horizontal line whose y-intercept is b.
Notice that for any real number we put in the function, the function value will be b. This tells us the range has only one value, b.
Constant Function
Try it!
Graph: f(x) = 4.
Solution:
| Steps | Algebraic |
| f(x) = 4 | |
| We recognize this as a constant function. | |
| The graph will be a horizontal line through
(0, 4). |
 |
Graph: f(x) = −2.
Solution:
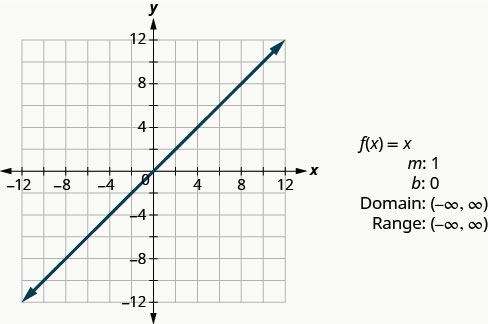
The identity function, f(x) = x is a special case of the linear function. If we write it in linear function form, f(x) = 1x + 0, we see the slope is 1 and the y-intercept is 0.
Identity Function
Try it! – Non-Linear Function
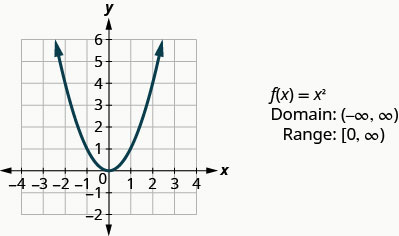
Graph: f(x) = x2.
Solution:
We choose x-values. We substitute them in and then create a chart as shown.
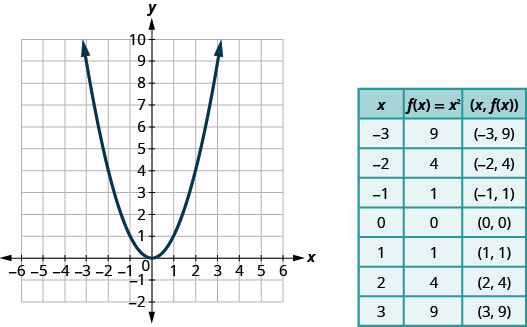
Looking at the result above, we can summarize the features of the square (Quadratic) function. We call this graph a parabola. As we consider the domain, notice any real number can be used as an x-value. The domain is all real numbers.
The range is not all real numbers. Notice the graph consists of values of y never go below zero. This makes sense as the square of any number cannot be negative. So, the range of the square function is all non-negative real numbers.
Square Function
The next function we will look at is also not a linear function so the graph will not be a line. Again we will use point plotting, and make sure to choose several positive and negative values as well as 0 for our x-values.
Try it! -Non-linear Function
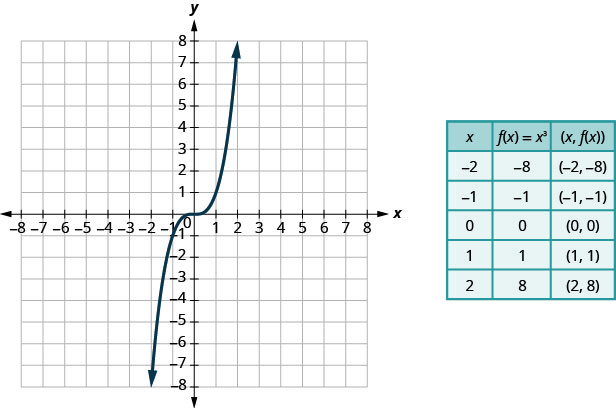
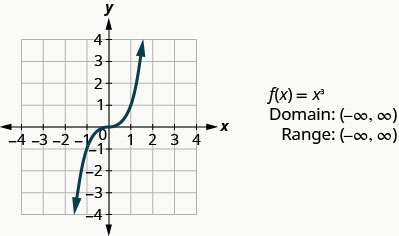
Graph: f(x) = x3.
Solution:
We choose x-values. We substitute them in and then create a chart.
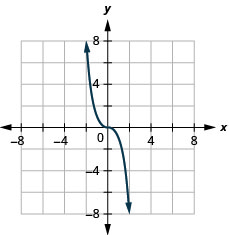
2. Graph: f(x) = −x3.
Solution:
Looking at the result in the first example on cube function above, we can summarize the features of the cube function. As we consider the domain, notice any real number can be used as an x-value. The domain is all real numbers.
The range is all real numbers. This makes sense as the cube of any non-zero number can be positive or negative. So, the range of the cube function is all real numbers.
Cube Function
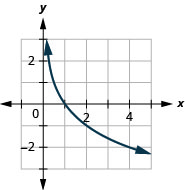
The next function we will look at does not square or cube the input values, but rather takes the square root of those values.
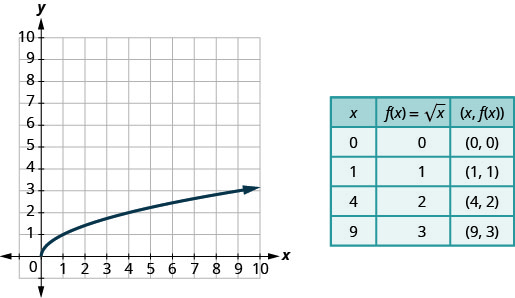
Let’s graph the function  and then summarize the features of the function. Remember, we can only take the square root of non-negative real numbers, so our domain will be the non-negative real numbers.
Try it!- Square root function
Solution:
We choose x-values. Since we will be taking the square root, we choose numbers that are perfect squares, to make our work easier. We substitute them in and then create a chart.
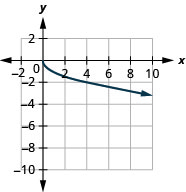
2. Graph: 
Solution:
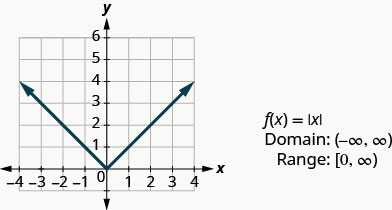
Square Root Function
[0, infinity)”, and “Range: [0, infinity)”.” width=”404″ height=”252″ />
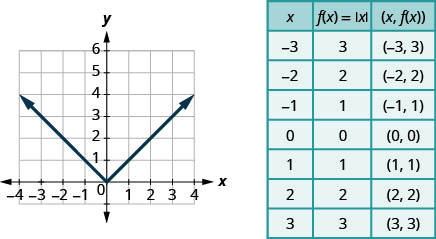
Our last basic function is the absolute value function, f(x) = |x|. Keep in mind that the absolute value of a number is its distance from zero. Since we never measure distance as a negative number, we will never get a negative number in the range.
Try It!- Absolute Value Function
Graph: f(x) = |x|.
Solution:
We choose x-values. We substitute them in and then create a chart.
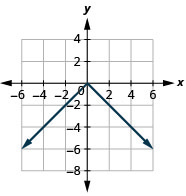
Graph: f(x) = −|x|.
Solution:
Absolute Value Function
Determining Even and Odd Functions
Some functions exhibit symmetry so that reflections result in the original graph. For example, horizontally reflecting the toolkit functions f(x) = x2 or f(x) = | x | will result in the original graph. We say that these types of graphs are symmetric about the y-axis. A function whose graph is symmetric about the y-axis is called an even function.
If the graphs of f(x) = x3 or f(x) =  were reflected over both axes, the result would be the original graph, as shown below.
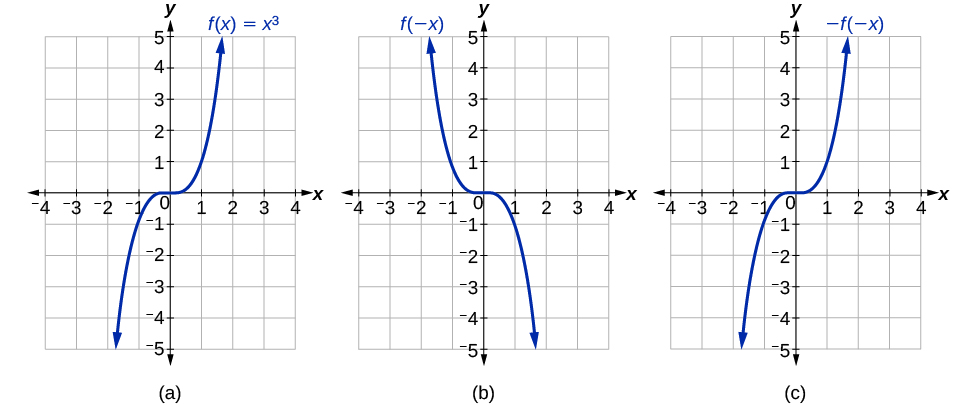
We say that these graphs are symmetric about the origin. A function with a graph that is symmetric about the origin is called an odd function.
Note: A function can be neither even nor odd if it does not exhibit either symmetry. For example, f(x) = 2x is neither even nor odd. Also, the only function that is both even and odd is the constant function f(x) = 0.
Even and Odd Functions
A function is called an even function if for every input x
f(x) = f(−x)
The graph of an even function is symmetric about the y-axis.
A function is called an odd function if for every input x
f(x) = −f(−x)
The graph of an odd function is symmetric about the origin.
How To: Given the formula for a function, determine if the function is even, odd, or neither.
- Determine whether the function satisfies f(x) = f(−x). If it does, it is even.
- Determine whether the function satisfies f(x) = −f(−x) If it does, it is odd.
- If the function does not satisfy either rule, it is neither even nor odd.
Try it! – Determining whether a Function Is Even, Odd, or Neither
Is the function f(x) = x3 + 2x even, odd, or neither?
Solution
Without looking at a graph, we can determine whether the function is even or odd by finding formulas for the reflections and determining if they return us to the original function. Let’s begin with the rule for even functions.
f(−x) = (−x)3 + 2(−x) = −x3 − 2x
This does not return us to the original function, so this function is not even. We can now test the rule for odd functions.
−f(−x) = −(−x3 − 2x) = x3 + 2x
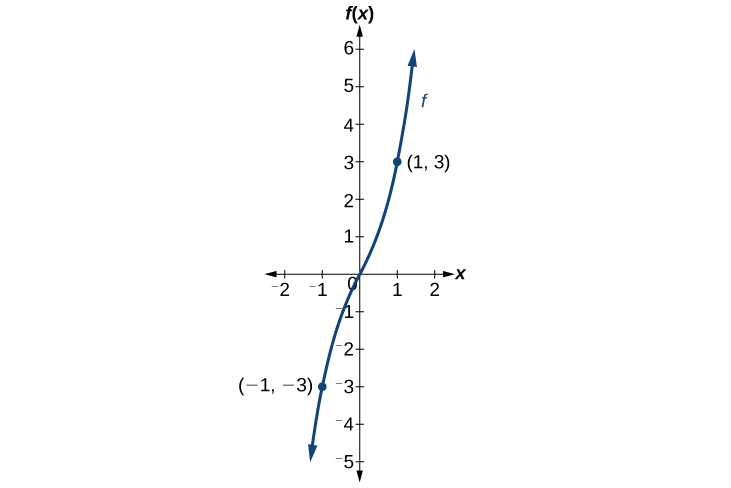
Because −f(−x) = f(x), this is an odd function.
Analysis Consider the graph of f below. Notice that the graph is symmetric about the origin. For every point (x, y) on the graph, the corresponding point (−x,−y) is also on the graph. For example, (1, 3) is on the graph of f, and the corresponding point (−1, −3) is also on the graph.
Is the function a) f(s) = s4 + 3s2 + 7, b) h(x) = + 3x even, odd, or neither?
Solution:
even
Difference Quotient
While we will look more closely at slope in the next section,
What is Slope?
The slope of a line, m, represents the vertical change in y over the horizontal change in x. Given two points, (x1, y1) and (x2, y2), the following formula determines the slope of a line containing these points:
m = 
Slope also indicates the direction in which a line slants as well as its steepness. Slope is sometimes described as rise over run.
We can use the slope of a line to a function at a point (a, f(a)) to estimate the rate of change, or the rate at which one variable changes in relation to another variable. We can obtain the slope by choosing a value of x near a and drawing a line through the points (a, f(a)) and (x, f(x)). The slope of this line is given by an equation in the form of a difference quotient:

We can also calculate the slope of a line to a function at a value a by using this equation and replacing x with a + h, where h is a value close to 0. We can then calculate the slope of the line through the points (a, f(a)) and (a+h,f(a+h)). In this case, we find the line has a slope given by the following difference quotient with increment h:

Difference Quotient
Let f be a function defined on an interval I containing a. If x ≠ a is in I, then
is a difference quotient. Also, if h ≠ 0 is chosen so that a + h is in I, then

is a difference quotient with increment h.
Try it!
Given the function g(x) = x2 + 2x, simplify  , x ≠ a.
Solution:
 , x ≠ a.
Evaluate f(x) = x2 + 3x − 4
- 2
- a
- a + h
Solution:
Replace the x in the function with each specified value.
- Because the input value is a number, 2, we can use simple algebra to simplify.
f(2) = 22 + 3(2) − 4 = 4 + 6 − 4 = 6
- In this case, the input value is a letter so we cannot simplify the answer any further.
f(a) = a2 + 3a − 4
- With an input value of a + h, we must use the distributive property.
f(a + h) = (a + h)2 + 3(a + h)−4 = a2 + 2ah + h2 + 3a + 3h−4
- In this case, we apply the input values to the function more than once, and then perform algebraic operations on the result. We already found that
f(a + h) = a2 + 2ah + h2 + 3a + 3h − 4
and we know that
f(a) = a2 + 3a − 4
Now we combine the results and simplify.
=  =
=  =
=  = 2a + h +3
Key Concepts
- Even functions are symmetric about the y-axis, whereas odd functions are symmetric about the origin.
- Even functions satisfy the condition f(x) = f(−x).
- Odd functions satisfy the condition f(x) = −f(−x).
- A function can be odd, even, or neither.
- Difference quotient
Q = - Difference quotient with increment h
Q =
A function whose graph is symmetric about the y-axis.
represents the vertical change in y over the horizontal change in x. Sometimes described as rise over run.
