13 Relations and Functions
Topics Covered
Find the Domain and Range of a Relation
As we go about our daily lives, we have many data items or quantities that are paired to our names. Our social security number, student ID number, email address, phone number and our birthday are matched to our name. There is a relationship between our name and each of those items.
When your professor gets her class roster, the names of all the students in the class are listed in one column and then the student ID number is likely to be in the next column. If we think of the correspondence as a set of ordered pairs, where the first element is a student name and the second element is that student’s ID number, we call this a relation.
The set of all the names of the students in the class is called the domain of the relation and the set of all student ID numbers paired with these students is the range of the relation.
There are many similar situations where one variable is paired or matched with another. The set of ordered pairs that records this matching is a relation.
Relation
A relation is any set of ordered pairs, (x,y). All the x-values in the ordered pairs together make up the domain. All the y-values in the ordered pairs together make up the range.
{(1, 2), (2, 4), (3, 6), (4, 8), (5, 10)}
The domain is {1, 2, 3, 4, 5}. The range is {2, 4, 6, 8, 10}. Note that each value in the domain is also known as an input value, or independent variable, and is often labeled with the lowercase letter x. Each value in the range is also known as an output value, or dependent variable, and is often labeled lowercase letter y.
Try it!
For the relation {(1, 1), (2, 4), (3, 9), (4, 16), (5, 25)}:
a. Find the domain of the relation.
b. Find the range of the relation.
Solution:
{(1, 1), (2, 4), (3, 9), (4, 16), (5, 25)}
a. The domain is the set of all x-values of the relation. {1, 2, 3, 4, 5}
b. The range is the set of all y-values of the relation. {1, 4, 9, 16, 25}
#2
For the relation {(1, 1), (2,8), (3, 27), (4, 64), (5, 125)}:
a. Find the domain of the relation.
b. Find the range of the relation.
Solution:
a. {1, 2, 3, 4, 5}
b. {1, 8, 2, 7, 64, 125}
Mapping
A mapping is sometimes used to show a relation. The arrows show the pairing of the elements of the domain with the elements of the range.
Try it!
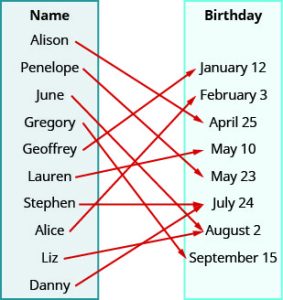
Use the mapping of the relation shown to a. list the ordered pairs of the relation, b. find the domain of the relation, and c. find the range of the relation.
Solution:
a. The arrow shows the matching of the person to their birthday. We create ordered pairs with the person’s name as the x-value and their birthday as the y-value.
{(Alison, April 25), (Penelope, May 23), (June, August 2), (Gregory, September 15), (Geoffrey, January 12), (Lauren, May 10), (Stephen, July 24), (Alice, February 3), (Liz, August 2), (Danny, July 24)}
b. The domain is the set of all x-values of the relation.
{Alison, Penelope, June, Gregory, Geoffrey, Lauren, Stephen, Alice, Liz, Danny}
c. The range is the set of all y-values of the relation.
{January 12, February 3, April 25, May 10, May 23, July 24, August 2, September 15}
A graph is yet another way that a relation can be represented. The set of ordered pairs of all the points plotted is the relation. The set of all x-coordinates is the domain of the relation and the set of all y-coordinates is the range. Generally we write the numbers in ascending order for both the domain and range.
Try it!
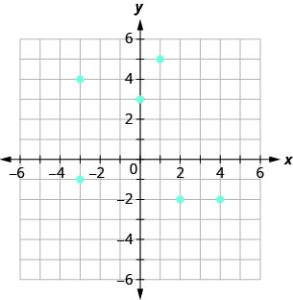
Use the graph of the relation to a. list the ordered pairs of the relation b. find the domain of the relation c. find the range of the relation.
Solution:
a. The ordered pairs of the relation are: {(1, 5), (−3, −1), (4, −2), (0, 3), (2, −2), (−3, 4)}.
b. The domain is the set of all x-values of the relation: {−3, 0, 1, 2, 4}.
Notice that while −3 repeats, it is only listed once.
c. The range is the set of all y-values of the relation: {−2, −1, 3, 4, 5}.
Notice that while −2 repeats, it is only listed once.
Determine if a Relation is a Function
A special type of relation, called a function, occurs extensively in mathematics. A function is a relation that assigns to each element in its domain exactly one element in the range. For each ordered pair in the relation, each x-value is matched with only one y-value. In other words, no x-values are repeated.
Function
A function is a relation in which each possible input value leads to exactly one output value. We say “the output is a function of the input.”
The input values make up the domain, and the output values make up the range.
The birthday example helps us understand this definition. Every person has a birthday but no one has two birthdays. It is okay for two people to share a birthday. It is okay that Danny and Stephen share July 24th as their birthday and that June and Liz share August 2nd. Since each person has exactly one birthday, the relation is a function.
The relation shown by the graph in the previous example includes the ordered pairs (−3,−1) and (−3,4). Is that okay in a function? No, as this is like one person having two different birthdays.
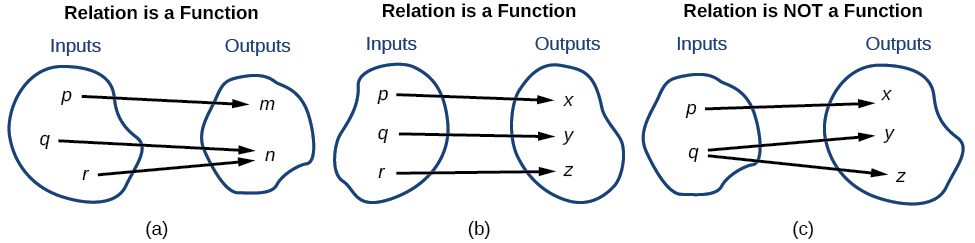
Using the example set above,{(1, 2), (2, 4), (3, 6), (4, 8), (5, 10)} this relation is a function because each element in the domain, {1, 2, 3, 4, 5}, is paired with exactly one element in the range, {2, 4, 6, 8, 10}. The image below compares relations that are functions and not functions.
Try it!
Use the set of ordered pairs to (i) determine whether the relation is a function (ii) find the domain of the relation (iii) find the range of the relation.
a. {(−3, 27), (−2, 8), (−1, 1), (0, 0), (1, 1), (2, 8), (3, 27)}
b. {(9, −3), (4, −2), (1, −1), (0, 0), (1, 1), (4, 2), (9, 3)}
Solution:
a. {(−3, 27), (−2, 8), (−1, 1), (0, 0), (1, 1), (2, 8), (3, 27)}
(i) Each x-value is matched with only one y-value. So this relation is a function.
(ii) The domain is the set of all x-values in the relation.
The domain is: {−3, −2, −1, 0, 1, 2, 3}.
(iii) The range is the set of all y-values in the relation. Notice we do not list range values twice.
The range is: {27, 8, 1, 0}.
b. {(9, −3), (4, −2), (1, −1), (0, 0), (1, 1), (4, 2), (9, 3)}
(i) The x-value 9 is matched with two y-values, both 3 and -3. So this relation is not a function.
(ii) The domain is the set of all x-values in the relation. Notice we do not list domain values twice.
The domain is: {0, 1, 2, 4, 9}.
(iii) The range is the set of all y-values in the relation.
The range is: {−3, −2, −1, 0, 1, 2, 3}.
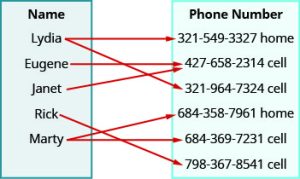
#2 Use the mapping to ⓐ determine whether the relation is a function ⓑ find the domain of the relation ⓒ find the range of the relation.
Solution:
a. Both Lydia and Marty have two phone numbers. So each x-value is not matched with only one y-value. So this relation is not a function.
b. The domain is the set of all x-values in the relation. The domain is: {Lydia, Eugene, Janet, Rick, Marty}
c. The range is the set of all y-values in the relation. The range is:
{321-549-3327, 427-658-2314, 321-964-7324, 684-358-7961, 684-369-7231, 798-367-8541}
In algebra, more often than not, functions will be represented by an equation. It is easiest to see if the equation is a function when it is solved for y. If each value of x results in only one value of y, then the equation defines a function.
Determine whether each equation is a function.
a. 2x + y = 7 b. y = x2 + 1 c. x + y2 = 3
Solution:
a. 2x + y = 7
For each value of x, we multiply it by −2 and then add 7 to get the y-value
| Steps | Algebraic |
| Problem | |
| For example, if x = 3: | |
| Solution |
We have that when x = 3, then y = 1. It would work similarly for any value of x. Since each value of x, corresponds to only one value of y the equation defines a function.
b. y = x2 + 1
For each value of x, we square it and then add 1 to get the y-value.
| Steps | Algebraic |
| For example, if x = 2: | |
We have that when x = 2, then y = 5. It would work similarly for any value of x. Since each value of x, corresponds to only one value of y the equation defines a function.
c. x + y2 = 3
| Steps | Algebraic |
| Isolate the y term. | |
| Let’s substitute x = 2. | |
| This give us two values for y. | y = 1 |
We have shown that when x = 2, then y = 1 and y = −1. It would work similarly for any value of x. Since each value of x does not correspond to only one value of y the equation does not define a function.
Determine whether each equation is a function.
a. x + y2 = 4 b. y = x2 − 7 c. y = 5x − 4
Solution:
a. no b. yes c. yes
Find the Value of a Function
It is very convenient to name a function and most often we name it f, g, h, F, G, or H. In any function, for each x-value from the domain we get a corresponding y-value in the range. For the function f, we write this range value y as f(x). This is called function notation and is read f of x or the value of f at x. In this case the parentheses does not indicate multiplication.
Function Notation
For the function y = f(x)
x is the domain value
f(x) is the range value y corresponding to the value x
We read f(x) as f of x or the value of f at x.
Example
| h is f of a | We name the function f; height is a function of age. |
| h = f(a) | We use parentheses to indicate the function input. |
| f(a) | We name the function f; the expression is read as “f of a.” |
Remember, we can use any letter to name the function; the notation h(a) shows us that h depends on a. The value a must be put into the function h to get a result. The parentheses indicate that age is input into the function; they do not indicate multiplication.
We call x the independent variable as it can be any value in the domain. We call y the dependent variable as its value depends on x.
Independent and Dependent Variables
For the function y = f(x),
y the dependent variable as its value depends on x
Let’s look at the equation y = 4x − 5. To find the value of y when x = 2, we know to substitute x = 2 into the equation and then simplify.
| Steps | Algebraic |
| Let x = 2. | |
The value of the function at x = 2 is 3.
We do the same thing using function notation, the equation y = 4x − 5 can be written as f(x) = 4x − 5. To find the value when x = 2, we write:
| Steps | Algebraic |
| Let x = 2. | |
The value of the function at x = 2 is 3.
This process of finding the value of f (x) for a given value of x is called evaluating the function.
Try it!
For the function f(x) = 2x2 + 3x − 1, evaluate the function.
a. f(3) b. f(−2) c. f(a)
Solution:
a.
| Steps | Algebraic |
| To evaluate f(3), substitute 3 for x. | |
| Simplify. | |
b.
| Steps | Algebraic |
To evaluate f(-2), substitute -2 for x. |
|
| Simplify. | |
c.
| Steps | Algebraic |
| To evaluate f(a), substitute a for x. | |
| Simplify. |
In the last example, we found f(x) for a constant value of x. In the next example, we are asked to find g(x) with values of x that are variables. We still follow the same procedure and substitute the variables in for the x.
Try it!
For the function g(x) = 3x − 5, evaluate the function.
a. g(h2) b. g(x + 2) c. g(x) + g(2)
Solution:
a.
| Steps | Algebraic |
| To evaluate g(h2),substitute h2 for x. | |
b.
| Steps | Algebraic |
| To evaluate g(x + 2), substitute x + 2 for x. | |
| Simplify. | |
c.
| Steps | Algebraic |
| To evaluate g(x) + g(2), first find g(2). | |
Now find g(x) + g(2) |
|
| Simplify. | |
Notice the difference between part ⓑ and ⓒ. We get g(x+2) = 3x + 1 and g(x) + g(2) = 3x − 4. So we see that g(x + 2) ≠ g(x) + g(2).
Some functions are defined by mathematical rules or procedures expressed in equation form. If it is possible to express the function output with a formula involving the input quantity, then we can define a function in algebraic form. For example, the equation 2n+6p=12 expresses a functional relationship between n and p.
We can rewrite it to decide if p is a function of n.
Try it!
Does the equation x2 + y2 = 1 represent a function with x as input and y as output? If so, express the relationship as a function y = f (x).
Solution:
| Steps | Algebraic |
| First we subtract x2 from both sides. | y2 = 1 − x2 |
| We now try to solve for y in this equation. | y = ±  and − and −  |
We get two outputs corresponding to the same input, so this relationship cannot be represented as a single function y = f (x). If we graph both functions on a graphing calculator, we will get the upper and lower semicircles.
If x − 8y3 = 0, express y as a function of x.
Solution:
y = f (x) = ![\displaystyle\frac{\sqrt[3]{x}}{2}](https://utsa.pressbooks.pub/app/uploads/quicklatex/quicklatex.com-45eda600d8b6de9f3ed9ca30badbaae4_l3.png "Rendered by QuickLaTeX.com")
Many everyday situations can be modeled using functions.
Try it!
#2 The number of unread emails in Sylvia’s account is 75. This number grows by 10 unread emails a day. The function N(t) = 75 + 10t represents the relation between the number of emails, N, and the time, t, measured in days.
a. Determine the independent and dependent variable.
b. Find N(5). Explain what this result means.
Solution:
a. The number of unread emails is a function of the number of days. The number of unread emails, N, depends on the number of days, t. Therefore, the variable N, is the dependent variable and the variable t is the independent variable.
b. Find N(5). Explain what this result means.
| Steps | Algebraic |
| Substitute in t = 5. | |
| Simplify. | |
Since 5 is the number of days, N(5), is the number of unread emails after 5 days. After 5 days, there are 125 unread emails in the account.
Access this online resource for additional instruction and practice with relations and functions.
Vertical Line Test
In the last section we learned how to determine if a relation is a function. The relations we looked at were expressed as a set of ordered pairs, a mapping or an equation. We will now look at how to tell if a graph is that of a function.
An ordered pair (x, y) )is a solution of a linear equation, if the equation is a true statement when the x– and y-values of the ordered pair are substituted into the equation.
The graph of a linear equation is a straight line where every point on the line is a solution of the equation and every solution of this equation is a point on this line.
Below, we can see that, in graph of the equation y = 2x − 3, for every x-value there is only one y-value, as shown in the accompanying table.
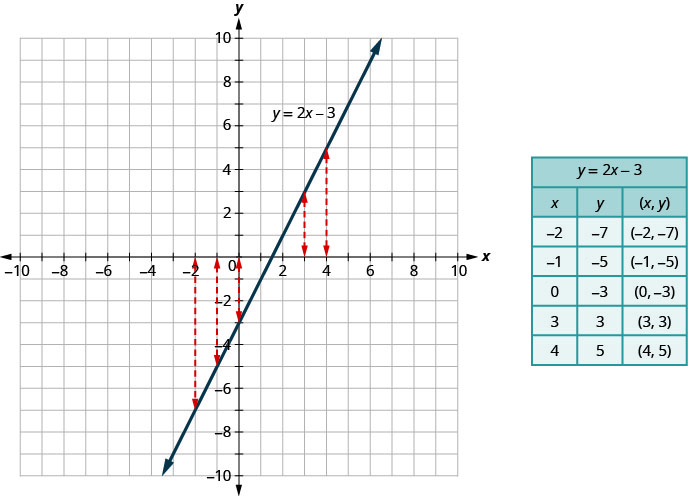
A relation is a function if every element of the domain has exactly one value in the range. So the relation defined by the equation y = 2x − 3 is a function. If we look at the graph, each vertical dashed line only intersects the line at one point. This makes sense as in a function, for every x-value there is only one y-value. If the vertical line hit the graph twice, the x-value would be mapped to two y-values, and so the graph would not represent a function. This leads us to the vertical line test. A set of points in a rectangular coordinate system is the graph of a function if every vertical line intersects the graph in at most one point. If any vertical line intersects the graph in more than one point, the graph does not represent a function.
Vertical Line Test
A set of points in a rectangular coordinate system is the graph of a function if every vertical line intersects the graph in at most one point.
If any vertical line intersects the graph in more than one point, the graph does not represent a function.

Try it!
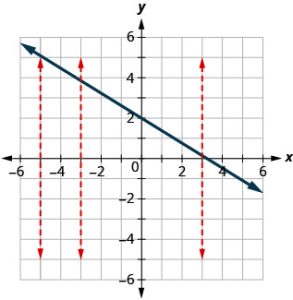
Determine whether each graph is the graph of a function.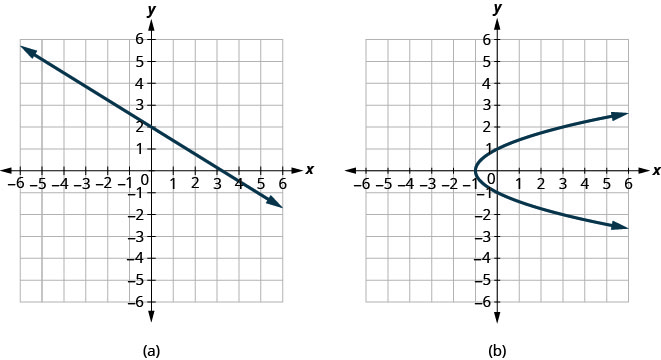
Solution:
a. Since any vertical line intersects the graph in at most one point, the graph is the graph of a function.
b. One of the vertical lines shown on the graph, intersects it in two points. This graph does not represent a function.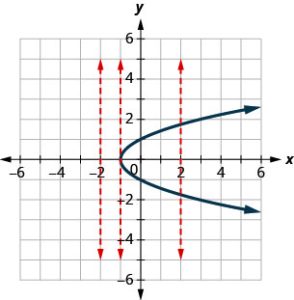
Domain Review
In this section, we will practice determining domains and ranges for specific functions. We can write the domain and range in interval notation, which uses values within brackets to describe a set of numbers. In interval notation, we use a square bracket [ when the set includes the endpoint and a parenthesis ( to indicate that the endpoint is either not included or the interval is unbounded. For example, if a person has $100 to spend, he or she would need to express the interval that is more than 0 and less than or equal to 100 and write (0,100]. We will discuss interval notation in greater detail later.
Let’s turn our attention to finding the domain of a function whose equation is provided. Oftentimes, finding the domain of such functions involves remembering three different forms. First, if the function has no denominator or an even root, consider whether the domain could be all real numbers. Second, if there is a denominator in the function’s equation, exclude values in the domain that force the denominator to be zero. Third, if there is an even root, consider excluding values that would make the radicand negative. Before we begin, let us review the conventions of interval notation:
- The smallest number from the interval is written first.
- The largest number in the interval is written second, following a comma.
- Parentheses, ( or ), are used to signify that an endpoint value is not included, called exclusive. They represent solutions greater or less than the number.
- Brackets, [ or ], are used to indicate that an endpoint value is included, called inclusive. They also represent solutions that are greater than or equal to or less than or equal to the number
| Set Indicated | Set-Builder Notation | Interval Notation |
|---|---|---|
| All real numbers between a and b, but not including a or b | {x|a < x < b} | (a, b) |
| All real numbers greater than a, but not including a | {x|x > a} | (a, ∞) |
| All real numbers less than b, but not including b | {x|x < b} | (−∞, b) |
| All real numbers greater than a, including a | {x|x ≥ a} | [a, ∞) |
| All real numbers less than b, including b | {x|x ≤ b} | (−∞, b] |
| All real numbers between a and b, including a | {x|a ≤ x < b} | [a, b) |
| All real numbers between a and b, including b | {x|a < x ≤ b} | (a, b] |
| All real numbers between a and b, including a and b | {x|a ≤ x ≤ b} | [a, b] |
| All real numbers less than a or greater than b | {x|x < a or x > b} | (−∞, a) ∪ (b, ∞) |
| All real numbers | {x|x is a real number} | (−∞, ∞) |
This format set-builder notation: {x|10 ≤ x < 30} describes the behavior of x in set-builder notation. The braces { } are read as “the set of,” and the vertical bar | is read as “such that,” so we would read {x | 10 ≤ x < 30} as “the set of x-values such that 10 is less than or equal to x, and x is less than 30.”
Try it! – Finding the Domain of a Function as a Set of Ordered Pairs
Find the domain of the following function: {(2, 10), (3, 10), (4, 20), (5, 30), (6, 40)}.
Given a function written in equation form, find the domain.
- Identify the input values.
- Identify any restrictions on the input and exclude those values from the domain.
- Write the domain in interval form, if possible.
Try it! – Finding the Domain of a Function
Find the domain of the function f(x) = x2 − 1.
Solution:
The input value, shown by the variable x in the equation, is squared and then the result is lowered by one. Any real number may be squared and then be lowered by one, so there are no restrictions on the domain of this function. The domain is the set of real numbers.
In interval form, the domain of f is (−∞, ∞).
Read Information from Graphs
We will start by reading the domain and range of a function from its graph.
Remember the domain is the set of all the x-values in the ordered pairs in the function. To find the domain we look at the graph and find all the values of x that have a corresponding value on the graph. Follow the value x up or down vertically. If you hit the graph of the function then x is in the domain. Remember the range is the set of all the y-values in the ordered pairs in the function. To find the range we look at the graph and find all the values of y that have a corresponding value on the graph. Follow the value y left or right horizontally. If you hit the graph of the function then y is in the range.
Try it!
Use the graph of the function to find its domain and range. Write the domain and range in interval notation.
![This figure has a curved line segment graphed on the x y-coordinate plane. The x-axis runs from negative 4 to 4. The y-axis runs from negative 4 to 4. The curved line segment goes through the points (negative 3, negative 1), (1.5, 3), and (3, 1). The interval [negative 3, 3] is marked on the horizontal axis. The interval [negative 1, 3] is marked on the vertical axis.](https://utsa.pressbooks.pub/app/uploads/sites/141/2023/05/CNX_IntAlg_Figure_03_06_021_img_new-296x300-1.jpg)
Solution:
To find the domain we look at the graph and find all the values of x that correspond to a point on the graph. The domain is highlighted in red on the graph. The domain is [−3,3].
To find the range we look at the graph and find all the values of y that correspond to a point on the graph. The range is highlighted in blue on the graph. The range is [−1,3].
Use the graph of the function to find its domain and range. Write the domain and range in interval notation.
![This figure has a curved line segment graphed on the x y-coordinate plane. The x-axis runs from negative 6 to 6. The y-axis runs from negative 6 to 6. The curved line segment goes through the points (negative 5, negative 4), (0, negative 3), and (1, 2). The interval [negative 5, 1] is marked on the horizontal axis. The interval [negative 4, 2] is marked on the vertical axis.](https://utsa.pressbooks.pub/app/uploads/sites/141/2023/05/CNX_IntAlg_Figure_03_06_022_img_new-296x300-1.jpg)
Solution:
The domain is [−5,1] The range is [−4,2].
Key Concepts
- Function Notation: For the function y = f(x)
- f is the name of the function
- x is the domain value
- f(x) is the range value y corresponding to the value x
We read f(x) as f of x or the value of f at x.
- Independent and Dependent Variables: For the function y = f(x),
- x is the independent variable as it can be any value in the domain
- y is the dependent variable as its value depends on x
- Vertical Line Test
- A set of points in a rectangular coordinate system is the graph of a function if every vertical line intersects the graph in at most one point.
- If any vertical line intersects the graph in more than one point, the graph does not represent a function.
- Graph of a Function
- The graph of a function is the graph of all its ordered pairs, (x, y) or using function notation, (x, f(x)) where y = f(x).
| f | name of function |
| x | x-coordinate of the ordered pair |
| f(x) | y-coordinate of the ordered pair |
is any set of ordered pairs, (x,y).
is the graph of a function if every vertical line intersects the graph in at most one point.
